Fig. 2
Download original image
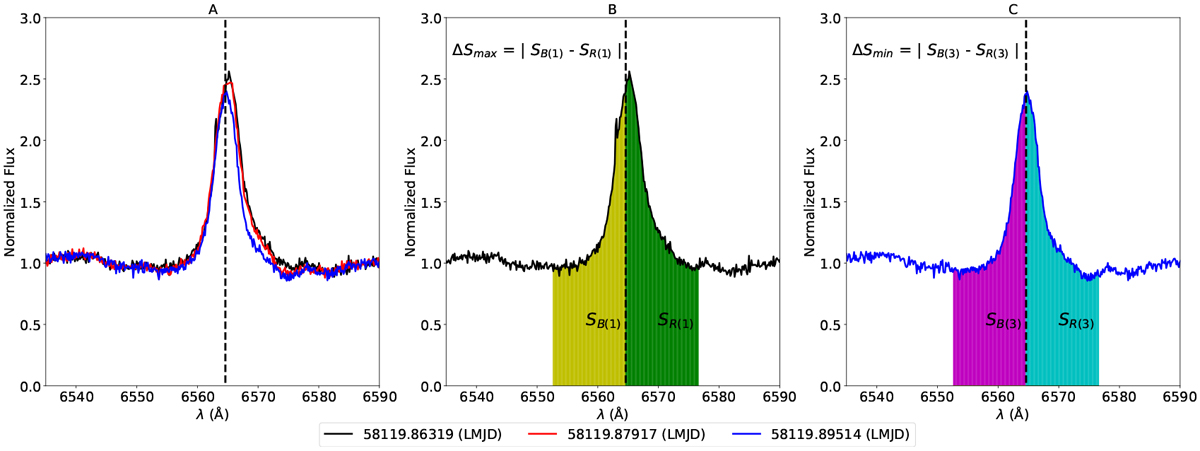
Schematic diagram of the partition integral comparing method (PICM) for stellar CME detection. Panel A shows the Hα line profiles in a pre-processed file. Panels B and C show the maximum (∆Smax) and minimum values (∆Smin) of the ∆Sn, respectively. The ∆Sn is the absolute value of the difference between the integrals on the blue and red halves of each Hα profile. The vertical dotted black line represents the rest wavelength of the Hα line in each panel.
Current usage metrics show cumulative count of Article Views (full-text article views including HTML views, PDF and ePub downloads, according to the available data) and Abstracts Views on Vision4Press platform.
Data correspond to usage on the plateform after 2015. The current usage metrics is available 48-96 hours after online publication and is updated daily on week days.
Initial download of the metrics may take a while.