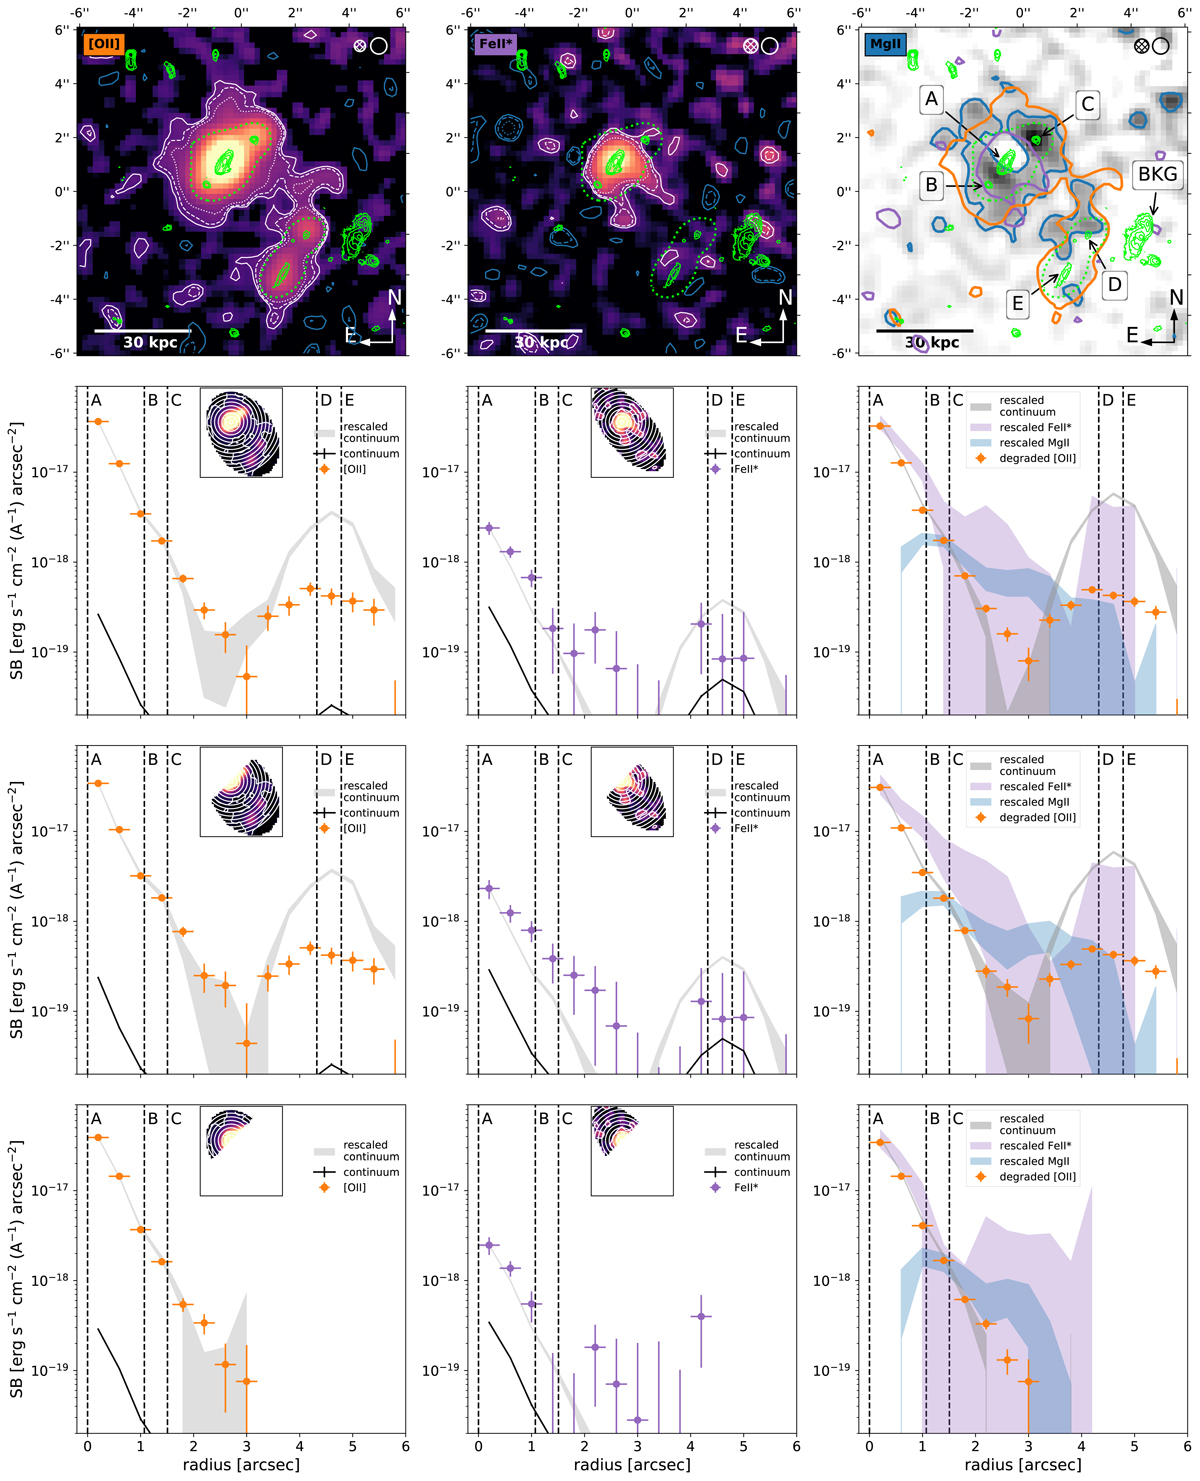
Fig. 7.
Download original image
[O II] and Fe II* spatial properties. First column: [O II] NB image (top, Sect. 5.1). Legend is the same as in Fig. 3a. The 1σ level corresponds to a SB of 2.5 × 10⁻¹⁹ erg s−1 cm−2 arcsec−2. Bottom panels: total and directional (below and above the [A,B,C] axis) azimuthally averaged radial SB profiles centered on galaxy A (from top to bottom, respectively, see also insets for illustration) of the [O II], [O II] continuum and rescaled [O II] continuum (orange, black and gray, respectively) emission. The radial positions of other group members with respect to galaxy A are indicated by the vertical dashed lines. Second column: same as first column but for Fe II* (purple). Third column: comparison of the Mg II, [O II] and Fe II* 2σ significance level contours (blue, orange, and purple, respectively) superimposed on the Mg II NB image (top). Bottom panels: show a comparison of the radial SB profiles where the Fe II* profile (shaded purple) has been rescaled to the [O II] profile at the SB peak and Mg II (shaded blue) at the position of galaxy C (Appendix D). For this plot the [O II] map was degraded to the resolution of the Mg II emission (Sect. 5.1).
Current usage metrics show cumulative count of Article Views (full-text article views including HTML views, PDF and ePub downloads, according to the available data) and Abstracts Views on Vision4Press platform.
Data correspond to usage on the plateform after 2015. The current usage metrics is available 48-96 hours after online publication and is updated daily on week days.
Initial download of the metrics may take a while.