| Issue |
A&A
Volume 685, May 2024
|
|
|---|---|---|
| Article Number | L2 | |
| Number of page(s) | 8 | |
| Section | Letters to the Editor | |
| DOI | https://doi.org/10.1051/0004-6361/202449900 | |
| Published online | 30 April 2024 | |
Letter to the Editor
The galaxy group merger origin of the Cloverleaf odd radio circle system
1
Max Planck Institute for Extraterrestrial Physics, Giessenbachstrasse 1, 85748 Garching, Germany
e-mail: This email address is being protected from spambots. You need JavaScript enabled to view it.
2
Hamburg Observatory, University of Hamburg, Gojenbergsweg 112, 21029 Hamburg, Germany
3
CSIRO Astronomy and Space Science, Australia Telescope National Facility, PO Box 76 NSW 1710, Australia
4
School of Science, Western Sydney University, Locked Bag 1797, Penrith, NSW 2751, Australia
Received:
8
March
2024
Accepted:
8
April
2024
Abstract
Odd radio circles (ORCs) are a newly discovered class of extended faint radio sources of unknown origin. We report the first detection of diffuse X-ray gas at the location of a low-redshift ORC (z = 0.046) known as Cloverleaf ORC. This observation was performed with the XMM-Newton X-ray telescope. The physical extent of the diffuse X-ray emission corresponds to a region of approximately 230 kpc by 160 kpc, lying perpendicular to the radio emission detected by ASKAP. The X-ray spectrum shows characteristics of thermal multiphase gas with temperatures of 1.10 ± 0.08 keV and 0.22 ± 0.01 keV and a central density of (4.9 ± 0.6)×10−4 cm−3, indicating that the Cloverleaf ORC resides in a low-mass galaxy group. Using X-ray observations, with hydrostatic equilibrium and isothermal assumptions, we measure the galaxy group to have a gas mass and a total mass of (7.7 ± 0.8)×1011 M⊙ and 2.6 ± 0.3 × 10¹³ M⊙ within the overdensity radius R500. The presence of a high-velocity subgroup identified in optical data, the orientation of the brightest cluster galaxy, the disturbed morphologies of galaxies toward the east of the Cloverleaf ORC, and the irregular morphology of the X-ray emission suggest that this system is undergoing a galaxy group merger. The radio power of the ORC could be explained by the shock reacceleration of fossil cosmic rays generated by a previous episode of black hole activity in the central active galactic nucleus.
Key words: galaxies: evolution / galaxies: groups: general / radio continuum: galaxies / X-rays: galaxies
© The Authors 2024
 Open Access article, published by EDP Sciences, under the terms of the Creative Commons Attribution License (https://creativecommons.org/licenses/by/4.0), which permits unrestricted use, distribution, and reproduction in any medium, provided the original work is properly cited.
This article is published in open access under the Subscribe to Open model.
Open access funding provided by Max Planck Society.
1. Introduction
Recent radio surveys, including the Australian SKA Pathfinder (ASKAP), revealed a novel category of faint radio sources known as odd radio circles (ORCs), which were later confirmed with the Giant Metrewave Radio Telescope (GMRT) and MeerKAT (Norris et al. 2021; Koribalski et al. 2021, 2023; Lochner et al. 2023). Only eight ORCs are associated with an optical counterpart, elliptical galaxies with reported stellar masses of approximately ∼1011 M⊙, also known as cosmological or extragalactic ORCs. The redshifts of the galaxies associated with the known ORCs range between 0.05 and 0.6, with a typical ORC size of 300 kpc to 500 kpc. Many of these sources have large ring-like emission, bright and clumpy at the edges, with several irregular emission peaks in their centers. The reported radio powers are several times 1023 W Hz−1 and have radio brightness of 2−9 mJy at GHz frequencies.
Various physical explanations of the nature of the extragalactic ORCs are proposed. These include the forward termination shock resulting from past starburst events (Norris et al. 2021, 2022), binary supermassive black hole mergers (Koribalski et al. 2021; Norris et al. 2022), supernova remnants within the Local Group (Filipović et al. 2022; Omar 2022; Sarbadhicary et al. 2023), tidal disruptions of stars by intermediate-mass or supermassive black holes (Omar 2022), synchrotron emission from virial shocks around massive galaxies (Yamasaki et al. 2024) and synchrotron emission from the historical activity of galactic outflows (Coil et al. 2024), and end-on active galactic nucleus (AGN) jet-inflated bubbles (Lin & Yang 2024). Recently, Dolag et al. (2023) postulated that the internal shocks from forming the group-size halos might explain the detection frequency and morphology of the ORC populations by employing nonradiative high-resolution simulations of a Milky Way-mass galactic halo. The halos with the dark matter halo virial mass of 1012 − 1013 M⊙ with stellar masses of several times 1011 M⊙ with internal shock Mach number 2.1−2.4 may explain these observed features. However, a direct shock acceleration mechanism of the cosmic-ray electrons fails to reproduce the observed luminosities of the radio emission.
The Cloverleaf ORC, discovered by the Australian SKA Pathfinder (ASKAP), is one of the lowest redshift ORCs known to date (Dolag et al. 2023; Koribalski et al., in prep.). The optical counterpart of the ORC is the elliptical galaxy GAMA J113727.46−005047.6 at (RA: 174.3644°, Dec: −0.8467°), hereafter brightest cluster galaxy 1 (BCG1), with a stellar mass of 1.4 ± 0.3 × 10¹¹ M⊙ with a spectroscopic redshift of 0.046399 ± 1.2 × 10⁻⁵ (Driver et al. 2022). Previously, the Cloverleaf system was cataloged as a galaxy group under the name MZ 07128 in the 2dF survey (2dFGGC) galaxy group catalog in the Sloan Digital Sky Survey (Merchán & Zandivarez 2002). The galaxy GAMA J113727.46−005047.6 (CATAID = 534655)1 is also classified as the central galaxy of a low-mass galaxy group with eight total members using the friends-of-friends method in the complete Galaxy and Mass Assembly I (GAMA-I) survey galaxy group catalog (G3Cv10; Robotham et al. 2011), with group ID 200792.
In this work we report the first detection of diffuse X-ray emission in the Cloverleaf ORC using XMM-Newton observations. Combining the observed X-ray, optical, and radio properties of the ORC, we explore the possible nature of these intriguing sources. In Sect. 2, we describe the X-ray data reduction and analysis. The results from multi-wavelength data and discussion based on the results are provided in Sect. 3, and finally, we present our conclusions in Sect. 4.
2. X-ray data analysis
The XMM-Newton observations of the Cloverleaf ORC were performed on November 28, 2023, as a Director’s Discretionary Time (DDT) observation 0932390201 (PI: Bulbul). Due to the bright star in the field of view at RA = 174.23 and Dec = −0.82, the filter wheels of the two MOS detectors were automatically switched to the CalClosed positions. Therefore, only the data from the PN detector is available for scientific analysis. We used Scientific Analysis System (SAS) 21.0.0 software for data reduction, which follows the process described in Zhang et al. (2023). After filtering the flare time intervals, the clean exposure time is 21.6 ks.
2.1. Imaging analysis
We adopt the 0.5−1.2 keV band for imaging analysis. Point sources were detected using the ewavelet algorithm with parameters minscale=1, maxscale=16, and threshold=5. The resulting XMM-Newton X-ray, ASKAP, and composite X-ray, radio, and optical images from the DESI Legacy Data Release (DR10) data are shown in Fig. 1.
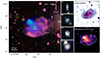 |
Fig. 1. Multi-wavelength image of the Cloverleaf odd radio circle system. Left: DESI Legacy Survey DR10 optical (white to yellow), XMM-Newton X-ray (blue), and ASKAP radio continuum (red) composite image of the Cloverleaf ORC. Middle: zoomed-in views of three morphologically disturbed galaxies (A, B, C) to the east and morphologically undisturbed galaxy (D) to the west. The BCG1, located at the X-ray and radio emission peak, and another bright elliptical galaxy (BCG2) are also shown. Top right: ASKAP 856 MHz image of the Cloverleaf ORC convolved to 20 arcsec resolution. Bottom right: EPIC-pn flux image in the 0.5−1.2 keV band. The image is source-removed and smoothed by a 20″ Gaussian kernel. Overlaid is the radio ASKAP contour of the Cloverleaf ORC (Koribalski et al., in prep.). |
We extracted an azimuthally averaged surface brightness profile using the 0.5−1.2 keV images around the centroid of the Cloverleaf ORC. The centroid of the system, which is assumed to be the middle of the two X-ray peaks, was adopted as the center of the extraction region. We fit the surface brightness profile using a β-profile density model (Cavaliere & Fusco-Femiano 1976),
![Mathematical equation: $$ \begin{aligned} n_{\rm e}(r) = n_{\rm e,0}\left[1+\left(\frac{r}{r_{\rm c}}\right)\right]^{-3\beta /2}, \end{aligned} $$](/articles/aa/full_html/2024/05/aa49900-24/aa49900-24-eq1.gif) (1)
(1)
where ne, 0 is the central electron density, rc is the core radius, and the parameter β defines the slope of the density profile.
2.2. Spectral analysis
We selected FLAG==0 events for spectral analysis within the 3′ radius region surrounding the centroid of the two X-ray peaks shown in Fig. 1. The background components consist of celestial X-ray photons and non-X-ray background (NXB) components. The former includes foreground emission from the Galactic Halo (GH) and cosmic X-ray background (CXB) as described in Bulbul et al. (2012). In addition to the XMM-Newton spectra, we extracted the combined spectrum (TM8) of the public eROSITA All-Sky Survey (eRASS1) observations in a region between 0.5−1 degree annulus centered on the Cloverleaf ORC by srctool in the eROSITA Science Analysis Software System (eSASS) software to constrain the foreground components and the contribution from the Milky Way halo to the background emission. The detected eRASS1 point and extended sources are masked when extracting the eRASS1 spectrum using the public catalogs (Bulbul et al. 2024; Merloni et al. 2024; Kluge et al. 2024).
We used the X-ray spectral fitting package (XSPEC) to co-fit the XMM-Newton and eROSITA spectra. All spectra were optimally binned using ftgrouppha before loading into XSPEC (Kaastra & Bleeker 2016). The detailed configurations of the background model components are described in Appendix A. The four spectra were fit simultaneously to constrain the temperature of the diffuse X-ray emission and model the foreground and the particle background. We extracted a global spectrum using a 3′ aperture, including the northern and southern X-ray peaks. The low signal-to-noise PN observations did not allow a detailed study of the metal and temperature distribution of the system. Therefore, we froze the abundance to be 0.3 Z⊙ for the rest of the spectral fits as typically assumed in galaxy clusters and groups (e.g., Bulbul et al. 2016; Mernier et al. 2018; Liu et al. 2020).
3. Results and discussion
The radio emission in the 856 MHz ASKAP image shows an elliptical boundary with a major axis of 4′ (227 kpc) to a minor axis of 2.8′ (137 kpc) with an inclination angle of ∼15° as plotted in the right panel of Fig. 1. The internal radio morphology clearly shows two peaks east of the ORC, 1 arcmin (55 kpc) apart from each other, with a shell-like emission surrounding the radio peaks. One of the two peaks is located at the position of the central galaxy. The detailed radio study of this ORC will be presented in Koribalski et al. (in prep.).
3.1. Properties of the diffuse gas
The new XMM-Newton observations show a clear diffuse X-ray emission at the location of the Cloverleaf ORC. The extended emission lies in the northeast direction perpendicular to the radio emission with a region size similar to a region approximately the size of an ellipse with axes of ∼1.9′ (100 kpc) to 3.3′ (180 kpc). The X-ray morphology of diffuse gas shows two clear peaks; the central galaxy is located at the center of the southern peak, which also marks the location of the brightest radio emission. In contrast, the X-ray peak in the northeast direction is 1.8′ (98 kpc) from the southern peak and is not associated with a galaxy. The centroid of the X-ray emission (i.e., the center of the two X-ray peaks) is 37 kpc from the center of the two radio peaks and 80 kpc from the center of the radio ellipse. The southern peak also shows clear X-ray detection of an AGN in the center. The lack of the optical counterpart at the center of the northeastern X-ray peak and the disturbed morphology of the intragroup medium (IGrM) indicate that this system is in a nonrelaxed dynamical state.
The X-ray spectroscopy provides measurements of the ambient gas temperature of the intragroup medium. The spectral fits adopting a single temperature scenario and free metal abundance yield a best-fit model with zero metallicity, suggesting a strong Fe-bias and the existence of a multi-temperature phase in the system (Simionescu et al. 2009). The best-fit temperature of the model is kBT = 0.74 ± 0.04 keV in a single-temperature scenario with a C-stat. value of 358.2/283. The two-temperature model significantly improves the spectral fit with components with kBT1 = 1.10 ± 0.08 keV and kBT2 = 0.23 ± 0.02 keV (C-stat. value of 277.9/281). The X-ray source, background spectra, and the two-temperature model fits are shown in Fig. 2. We also fit the individual spectra of the northeastern and southern X-ray emission. In a single-temperature model, the temperature of the northeastern X-ray peak is 0.75 ± 0.05 keV, and the southern peak has a slightly lower temperature of 0.31 ± 0.03 keV.
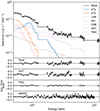 |
Fig. 2. XMM-Newton spectrum of the Cloverleaf ORC is shown in black in the top panel. The best-fit two-temperature IGrM model is shown as blue and orange, while the foreground and background models are plotted as dashed lines. The bottom panels indicate good fits after the background modeling, including NXB with the foreground modeling of the eRASS1 data. |
By fitting the azimuthally averaged X-ray surface brightness profile obtained from the XMM-Newton imaging analysis, we measure the central electron density to be ne, 0 = (4.9 ± 0.6)×10−4 cm−3. To measure the total mass at the physically meaningful overdensity radius, R500, defined as the radius within which the average density of the matter is 500 times the critical density of the Universe at the group’s redshift, we use an isothermal IGrM average temperature of 0.74 ± 0.04 keV (see Bulbul et al. 2012, for the details of the method). Under the assumption of hydrostatic equilibrium, we find that the total mass is (2.6 ± 0.3)×1013 M⊙ at R500 of 446 ± 40 kpc. Using the relation R500 = 0.659 R200 (see Bulbul et al. 2016), we find that the virial radius is ∼680 kpc. We note that the assumption of an isothermal IGrM here may underestimate the M500 uncertainty, and the current uncertainty reflects the precision of the measured electron density profile. Integrating the gas density over a volume encapsulated by the overdensity radius R500 gives a gas mass of (7.7 ± 0.8)×1011 M⊙. The fraction of gas mass to total mass yields a gas mass fraction of 0.03 ± 0.003, lower than the typical X-ray selected galaxy groups (Bulbul et al. 2024; Bahar et al. 2024).
In the 0.5−2.0 keV band, the flux and luminosity of the ORC are (2.3 ± 0.2)×10−13 erg s−1 cm−2 and (1.3 ± 0.1)×1042 erg s−1 within R500, respectively. We compare our luminosity and temperature measurements with the scaling relations of the eFEDS sample, including a larger number of galaxy groups, and find that the X-ray properties of the Cloverleaf system are consistent with the LX–kT relations of the eFEDS sample given the large scatter in these low-mass, low-IGrM temperature regimes (Bahar et al. 2022).
3.2. Dynamical state and the origin of the ORC
The catalogs in Kluge et al. (2024, see Appendix D) provide the photometric and spectroscopic redshifts of the galaxies in the literature in the western Galactic hemisphere. We search for galaxies with |ΔV|< 1000 km s−1 (5 × σV of the group), around the Cloverleaf ORC. The location and their velocity dispersion are shown in Fig. 3. The projected spatial distribution of galaxies within this velocity range is elongated in an east–west orientation. A substructure on the northeast boundary of the radio emission has a velocity discrepancy with > 600 km s−1 from the central galaxy. This substructure is also identified as an individual galaxy group (ID 201611) in the catalog of G3Cv10 (Robotham et al. 2011).
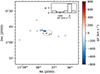 |
Fig. 3. Line-of-sight velocity structures of galaxies with zspec data within 30′ angular distance. The dashed contour is the boundary of the radio emission. The inset is the histogram of ΔV. |
By inspecting the morphology of individual galaxies in the DESI Legacy DR10 data (Dey et al. 2019)2, we find that three galaxies in the northeast of the central galaxy (A, B, and C in Fig. 1), which are possible members of the subgroup at similar redshifts, show disturbed morphologies. Galaxy A has a warped disk slightly stretched in the southwest direction, galaxy B has elongated diffuse stellar emission toward the south, and galaxy C has a disturbed disk with a blue clump in the southwest unrelated to the disk structure. This clump may indicate triggered star formation due to ram-pressure stripping as it is directed toward the X-ray emission. Conversely, galaxy D (zphot = 0.054 ± 0.010) shows a relaxed disk morphology. In our merger scenario, this galaxy is still in-falling. It has not yet undergone tidal interactions with the central galaxy, contrary to galaxies A, B, and C, with post-merger distortions in their morphology.
BCG1 is located at the center of the X-ray and radio peaks, while another bright elliptical galaxy (BCG2 in Fig. 1) is detected to the southwest of BCG1. It is likely that BCG2, which might be associated with the northeastern X-ray group, has already passed through the southern group due to the merger while lagging behind the highly collisional X-ray-emitting gas.
3.3. Comparison to other diffuse radio sources in groups and clusters
If the radio emission in the Cloverleaf ORC is caused by shock acceleration from merger shocks, it is worth comparing its properties to radio relics in galaxy clusters (e.g., Koribalski et al. 2023). Radio relics have powers of ∼1025 W Hz−1 at 1.4 GHz, and their power is a strong function of the cluster mass (Jones et al. 2023). Their coincidence with X-ray-detected shock waves has suggested that they are caused by merger shocks where cosmic-ray electrons are accelerated with fairly high efficiencies (Botteon et al. 2020). These shocks are usually found well within the cluster virial radius and have a moderate sonic Mach number of 2−3, unlike the cluster accretion shocks that sit outside the virial radius and have much higher Mach numbers.
In Fig. 4, we plot the radio luminosities of radio relics versus their mass. Here, we use the M500 of the Cloverleaf group measured in Sect. 3.1. We also scale the radio power of the Cloverleaf ORC from the 856 MHz frequency to the LOFAR high-band antenna central frequency of 150 MHz by assuming α = 1, which is the typical spectral index for radio relics in clusters (van Weeren et al. 2019). We find a mass difference of almost two orders of magnitude between the Cloverleaf ORC and known radio relics.
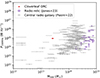 |
Fig. 4. Diagram of radio power vs. halo mass for the samples of radio relics (Jones et al. 2023) and central radio galaxies (Pasini et al. 2022) observed by LOFAR and the Cloverleaf ORC. The power of the Cloverleaf ORC is converted to the frequency of 150 MHz by assuming a α = 1 spectral index. The error bar of the Cloverleaf ORC radio power is within the mark. |
Radio relics are megaparsec-sized objects seen nearly edge-on; thus, radio power should decrease in smaller objects. This was confirmed by Dolag et al. (2023), who found that the high radio power observed in ORCs cannot be reproduced in numerical simulations. Reacceleration of fossil cosmic rays (CRs) could help reproduce the high observed radio power, as recently discussed by Shabala et al. (2024). These fossil cosmic rays could be injected by a central radio galaxy (e.g., powered by the AGN found in the Cloverleaf ORC). Then, the passage of a shock wave can sweep up the radio lobe and re-accelerate the plasma, creating the ORC. Shabala et al. (2024) discuss the combinations of viewing angles, angles between shock and radio lobe axis, as well as the age of the lobes that would lead to the observed ORC properties. This formation scenario also naturally explains the rarity of ORCs since only fairly narrow ranges in lobe ages and geometric factors lead to observable ORCs. Future simulations, including the role of magnetic fields, will have to explore this possibility. This scenario might also be validated by radio observations at very low radio frequencies that may detect the emission of remnant lobes.
The high radio power also suggests high magnetic field strengths, and, for reference, we can estimate the equipartition magnetic field. If the radio emission is homogeneous within the volume of the Cloverleaf ORC, the source depth is the average length of the long and short axes, which is 360 kpc. Meanwhile, we use the radio surface brightness close to the edge for a lower limit estimate. We estimate a minimum energy density contained in cosmic rays (CRs) of umin, CR + B = 3.2 × 10⁻¹⁴ erg cm−3Govoni & Feretti (2004), adopting α = 1. The corresponding revised magnetic field strength at equipartition is therefore  G by assuming γmin = 100 (Brunetti et al. 1997; Beck & Krause 2005). Both umin and
  are higher if we adopt steeper spectral indices. The estimated 1.2 μG equipartition magnetic field strength results in a magnetic pressure of PB = B2/8π ∼ 3.6 × 10⁻⁵ keV cm−3. For comparison, the thermal pressure in the hot IGrM can be calculated as Pth = nkBT ∼ 6.9 × 10⁻⁴ keV cm−3, taking the central gas density as an upper limit. The ratio of the thermal and magnetic pressures, βPL ≡ Pth/PB, is βPL ∼ 20 compared to > 100 in typical galaxy clusters (Donnert et al. 2018). However, we also note that in galaxy clusters, magnetic field strengths are around 1/20th of the equipartition field (Beresnyak 2019).
4. Conclusions
This work presented the first detection of diffuse X-ray emission from a recently discovered Cloverleaf odd radio circle. The extended X-ray source with an extent of 100 kpc by 180 kpc lies in the northeast direction perpendicular to the radio emission. The total 0.5−2 keV luminosity is (1.3 ± 0.1)×1042 erg s−1. The X-ray emission has two clear peaks. The southern X-ray peak has a counterpart, an elliptical central galaxy (BCG1), which also marks the location of the brightest radio emission. The northeastern peak does not have an optical counterpart or correspond to any radio peak. The offset between the centroid of the X-ray emission and radio emission is 80 kpc.
The X-ray emission has a thermal nature, where the average density of the gas is (7.0 ± 1.8)×10−5 cm−3 within R500, which is lower than typically observed in galaxy groups (Bahar et al. 2024). We measure the central electron density to be (4.9 ± 0.6)×10−4 cm−3. The temperature measurements of the gas indicate that it is in a multi-phase state with components of 1.10 ± 0.08 keV and 0.23 ± 0.02 keV. The corresponding gas and total masses are (7.7 ± 0.8)×1011 M⊙ and (2.6 ± 0.3)×1013 M⊙ within the overdensity radius of R500 of 446 ± 40 kpc, inferred from the X-ray observations under the hydrostatic equilibrium and isothermal IGrM assumptions. The flux and luminosity of the ORC are (2.3 ± 0.2)×10−13 erg s−1 cm−2 and (1.3 ± 0.1)×1042 erg s−1 measured within the same radius. The properties of the diffuse X-ray thermal gas indicate that the Cloverleaf ORC lies in an intra-group environment.
The disturbed morphology of the intra-group medium, the high-velocity subgroup identified at optical wavelengths, and the disturbed morphologies of galaxies toward the east around the Cloverleaf ORC suggest that this system is undergoing a merger activity. The absence of the central galaxy of the northeastern gas component may indicate that the collisionless member galaxies have already left behind the highly collisional intragroup medium. Such large offsets between the galaxy and X-ray gas are commonly observed in major galaxy cluster mergers (Markevitch et al. 2004).
If the elliptical morphology of radio emission has a shock origin, comparing the radius of radio emission of the ORC (∼200 kpc) and the virial radius of the galaxy group ∼680 kpc, the merger shock is the most likely explanation of the observed multiwavelength properties of this object. With eight known ORCs, any explanation of their origin must explain why they are rare. Dolag et al. (2023) argue that the galaxy mergers that produce ORCs must lead to a dramatic increase in the halo mass (by a factor of ∼3), which can explain why so few are seen. Moreover, there may be further constraints on the angle between the main merger axis and the line of sight, making them rarer still.
Our results indicate that, for the Cloverleaf ORC, merger shocks in galaxy group size halos are the most likely origin for the radio emission. To explain its high radio luminosity, a scenario that involves remnant radio lobes of a supermassive black hole, as discussed in Shabala et al. (2024), is plausible.
Acknowledgments
The authors thank the referee for helpful and constructive comments on the draft. E. Bulbul, X. Zhang, A. Liu, V. Ghirardini, C. Garrel, and S. Zelmer, acknowledge financial support from the European Research Council (ERC) Consolidator Grant under the European Union’s Horizon 2020 research and innovation program (grant agreement CoG DarkQuest No. 101002585). M.B. acknowledges funding by the Deutsche Forschungsgemeinschaft under Germany’s Excellence Strategy – EXC 2121 “Quantum Universe” – 390833306 and FOR 5195. N. Malavasi acknowledges funding by the European Union through a Marie Skłodowska-Curie Action Postdoctoral Fellowship (Grant Agreement: 101061448, project: MEMORY). This work is based on observations obtained with XMM-Newton, an ESA science mission with instruments and contributions directly funded by ESA Member States and NASA. This work uses public data from eROSITA, the soft X-ray instrument aboard SRG, a joint Russian-German science mission supported by the Russian Space Agency (Roskosmos), in the interests of the Russian Academy of Sciences represented by its Space Research Institute (IKI), and the Deutsches Zentrum für Luft und Raumfahrt (DLR). The SRG spacecraft was built by Lavochkin Association (NPOL) and its subcontractors and is operated by NPOL with support from the Max Planck Institute for Extraterrestrial Physics (MPE). The development and construction of the eROSITA X-ray instrument was led by MPE, with contributions from the Dr. Karl Remeis Observatory Bamberg & ECAP (FAU Erlangen-Nuernberg), the University of Hamburg Observatory, the Leibniz Institute for Astrophysics Potsdam (AIP), and the Institute for Astronomy and Astrophysics of the University of Tübingen, with the support of DLR and the Max Planck Society. The Argelander Institute for Astronomy of the University of Bonn and the Ludwig Maximilians Universität Munich also participated in the science preparation for eROSITA. The eROSITA data shown here were processed using the eSASS software system developed by the German eROSITA consortium. The Legacy Surveys consist of three individual and complementary projects: the Dark Energy Camera Legacy Survey (DECaLS; Proposal ID #2014B-0404; PIs: David Schlegel and Arjun Dey), the Beijing-Arizona Sky Survey (BASS; NOAO Prop. ID #2015A-0801; PIs: Zhou Xu and Xiaohui Fan), and the Mayall z-band Legacy Survey (MzLS; Prop. ID #2016A-0453; PI: Arjun Dey). DECaLS, BASS, and MzLS together include data obtained, respectively, at the Blanco telescope, Cerro Tololo Inter-American Observatory, NSF’s NOIRLab; the Bok telescope, Steward Observatory, University of Arizona; and the Mayall telescope, Kitt Peak National Observatory, NOIRLab. Pipeline processing and analyses of the data were supported by NOIRLab and the Lawrence Berkeley National Laboratory (LBNL). The Legacy Surveys project is honored to be permitted to conduct astronomical research on Iolkam Du’ag (Kitt Peak), a mountain with particular significance to the Tohono O’odham Nation. This scientific work uses data obtained from Inyarrimanha Ilgari Bundara/the Murchison Radio-astronomy Observatory. We acknowledge the Wajarri Yamaji People as the Traditional Owners and native title holders of the Observatory site. CSIRO’s ASKAP radio telescope is part of the Australia Telescope National Facility (https://ror.org/05qajvd42). Operation of ASKAP is funded by the Australian Government with support from the National Collaborative Research Infrastructure Strategy. ASKAP uses the resources of the Pawsey Supercomputing Research Centre. Establishment of ASKAP, Inyarrimanha Ilgari Bundara, the CSIRO Murchison Radio-astronomy Observatory and the Pawsey Supercomputing Research Centre are initiatives of the Australian Government, with support from the Government of Western Australia and the Science and Industry Endowment Fund.
References
- Asplund, M., Grevesse, N., Sauval, A. J., & Scott, P. 2009, ARA&A, 47, 481 [NASA ADS] [CrossRef] [Google Scholar]
- Bahar, Y. E., Bulbul, E., Clerc, N., et al. 2022, A&A, 661, A7 [NASA ADS] [CrossRef] [EDP Sciences] [Google Scholar]
- Bahar, Y. E., Bulbul, E., Ghirardini, V., et al. 2024, A&A, submitted [arXiv:2401.17276] [Google Scholar]
- Beck, R., & Krause, M. 2005, Astron. Nachr., 326, 414 [Google Scholar]
- Beresnyak, A. 2019, Liv. Rev. Comput. Astrophys., 5, 2 [CrossRef] [Google Scholar]
- Botteon, A., Brunetti, G., Ryu, D., & Roh, S. 2020, A&A, 634, A64 [NASA ADS] [CrossRef] [EDP Sciences] [Google Scholar]
- Brunetti, G., Setti, G., & Comastri, A. 1997, A&A, 325, 898 [NASA ADS] [Google Scholar]
- Bulbul, G. E., Smith, R. K., Foster, A., et al. 2012, ApJ, 747, 32 [NASA ADS] [CrossRef] [Google Scholar]
- Bulbul, E., Randall, S. W., Bayliss, M., et al. 2016, ApJ, 818, 131 [Google Scholar]
- Bulbul, E., Liu, A., Kluge, M., et al. 2024, A&A, in press, https://doi.org/10.1051/0004-6361/202348264 [Google Scholar]
- Cash, W. 1979, ApJ, 228, 939 [Google Scholar]
- Cavaliere, A., & Fusco-Femiano, R. 1976, A&A, 49, 137 [NASA ADS] [Google Scholar]
- Coil, A. L., Perrotta, S., Rupke, D. S. N., et al. 2024, Nature, 625, 459 [Google Scholar]
- Dey, A., Schlegel, D. J., Lang, D., et al. 2019, AJ, 157, 168 [Google Scholar]
- Dolag, K., Böss, L. M., Koribalski, B. S., Steinwandel, U. P., & Valentini, M. 2023, ApJ, 945, 74 [NASA ADS] [CrossRef] [Google Scholar]
- Donnert, J., Vazza, F., Brüggen, M., & ZuHone, J. 2018, Space Sci. Rev., 214, 122 [Google Scholar]
- Driver, S. P., Bellstedt, S., Robotham, A. S. G., et al. 2022, MNRAS, 513, 439 [NASA ADS] [CrossRef] [Google Scholar]
- Filipović, M. D., Payne, J. L., Alsaberi, R. Z. E., et al. 2022, MNRAS, 512, 265 [CrossRef] [Google Scholar]
- Govoni, F., & Feretti, L. 2004, Int. J. Mod. Phys. D, 13, 1549 [Google Scholar]
- Jones, A., de Gasperin, F., Cuciti, V., et al. 2023, A&A, 680, A31 [NASA ADS] [CrossRef] [EDP Sciences] [Google Scholar]
- Kaastra, J. S., & Bleeker, J. A. M. 2016, A&A, 587, A151 [NASA ADS] [CrossRef] [EDP Sciences] [Google Scholar]
- Kluge, M., & Bender, R. 2023, ApJS, 267, 41 [NASA ADS] [CrossRef] [Google Scholar]
- Kluge, M., Comparat, J., Liu, A., et al. 2024, A&A, submitted [arXiv:2402.08453] [Google Scholar]
- Koribalski, B. S., Norris, R. P., Andernach, H., et al. 2021, MNRAS, 505, L11 [NASA ADS] [CrossRef] [Google Scholar]
- Koribalski, B. S., Veronica, A., Brüggen, M., et al. 2023, MNRAS, submitted [arXiv:2304.11784] [Google Scholar]
- Lin, Y. H., & Yang, H. Y. K. 2024, ApJ, submitted [arXiv:2401.08207] [Google Scholar]
- Liu, A., Tozzi, P., Ettori, S., et al. 2020, A&A, 637, A58 [NASA ADS] [CrossRef] [EDP Sciences] [Google Scholar]
- Lochner, M., Rudnick, L., Heywood, I., Knowles, K., & Shabala, S. S. 2023, MNRAS, 520, 1439 [NASA ADS] [CrossRef] [Google Scholar]
- Markevitch, M., Gonzalez, A. H., Clowe, D., et al. 2004, ApJ, 606, 819 [NASA ADS] [CrossRef] [Google Scholar]
- Merchán, M., & Zandivarez, A. 2002, MNRAS, 335, 216 [CrossRef] [Google Scholar]
- Merloni, A., Lamer, G., Liu, T., et al. 2024, A&A, 682, A34 [NASA ADS] [CrossRef] [EDP Sciences] [Google Scholar]
- Mernier, F., Biffi, V., Yamaguchi, H., et al. 2018, Space Sci. Rev., 214, 129 [Google Scholar]
- Norris, R. P., Intema, H. T., Kapińska, A. D., et al. 2021, PASA, 38, e003 [NASA ADS] [CrossRef] [Google Scholar]
- Norris, R. P., Collier, J. D., Crocker, R. M., et al. 2022, MNRAS, 513, 1300 [NASA ADS] [CrossRef] [Google Scholar]
- Omar, A. 2022, Res. Notes Am. Astron. Soc., 6, 100 [Google Scholar]
- Pasini, T., Brüggen, M., Hoang, D. N., et al. 2022, A&A, 661, A13 [NASA ADS] [CrossRef] [EDP Sciences] [Google Scholar]
- Ponti, G., Zheng, X., Locatelli, N., et al. 2023, A&A, 674, A195 [NASA ADS] [CrossRef] [EDP Sciences] [Google Scholar]
- Robotham, A. S. G., Norberg, P., Driver, S. P., et al. 2011, MNRAS, 416, 2640 [NASA ADS] [CrossRef] [Google Scholar]
- Sarbadhicary, S. K., Thompson, T. A., Lopez, L. A., & Mathur, S. 2023, MNRAS, 526, 6214 [NASA ADS] [CrossRef] [Google Scholar]
- Shabala, S. S., Yates-Jones, P. M., Jerrim, L. A., et al. 2024, PASA, 41, e024 [NASA ADS] [CrossRef] [Google Scholar]
- Simionescu, A., Werner, N., Böhringer, H., et al. 2009, A&A, 493, 409 [NASA ADS] [CrossRef] [EDP Sciences] [Google Scholar]
- van Weeren, R. J., de Gasperin, F., Akamatsu, H., et al. 2019, Space Sci. Rev., 215, 16 [Google Scholar]
- Willingale, R., Starling, R. L. C., Beardmore, A. P., Tanvir, N. R., & O’Brien, P. T. 2013, MNRAS, 431, 394 [Google Scholar]
- Yamasaki, S., Sarkar, K. C., & Li, Z. 2024, MNRAS, 528, 3854 [NASA ADS] [CrossRef] [Google Scholar]
- Yeung, M. C. H., Freyberg, M. J., Ponti, G., et al. 2023, A&A, 676, A3 [NASA ADS] [CrossRef] [EDP Sciences] [Google Scholar]
- Zhang, X., Simionescu, A., Gastaldello, F., et al. 2023, A&A, 672, A42 [NASA ADS] [CrossRef] [EDP Sciences] [Google Scholar]
Appendix A: Assumed cosmology
In this work we adopt a Λ-cold-dark-matter cosmology with parameters H0 = 70 km s−1 Mpc−1, Ωm = 0.3, and ΩΛ = 0.7. At z = 0.0464, one arcsecond corresponds to a physical scale of 0.91 kpc.
Appendix B: Imaging analysis
For extracting the image, we selected (FLAG & 0xfb0825)! = 0 && PATTERN< =4 events. We adopted the cooling function in the [0.5, 1.2]×(1 + z) keV band at the system’s average temperature to convert the density to projected surface brightness.
Appendix C: Spectral analysis and models
Energy ranges, including fluorescent instrumental lines in the energy bands of 1.3–1.7 keV, 4.4–5.7 keV, and 7–11 keV, were ignored in the PN fittings. We used C-stat to calculate the fitting statistics (Cash 1979) and adopted the solar abundance table from Asplund et al. (2009).
The components in different spectra are listed in Table C.1. Among them, the components of celestial X-ray photons are convolved by the redistribution matrix file (RMF) and folded by the ancillary response file (ARF) for model calculation; components of particle background and Out-of-Time (OoT) are only convolved by the RMF for model calculation. The CXB includes 6.3% of OoT events and particle backgrounds whose spectra were generated from OoT event files and the stacked filter-wheel-closed (FWC) event file3, respectively.
Spectral components and the corresponding responses for individual spectra.
The detailed XSPEC spectral model definition of each component is listed in Table C.2. The redshifts of the source APEC models are fixed to 0.046; the hydrogen column density of the tbabs models are fixed to 2.3 × 10²⁰, which includes the contribution from both neutral hydrogen and molecular hydrogen (Willingale et al. 2013). The redshifts of both the Local Hot Bubble (LHB) and GH APEC models are fixed to zero. The abundance of the LHB APEC is fixed to 1.0 while that of the GH APEC model is set to be free, given the recent ∼0.06 Z⊙ measurement reported by Ponti et al. (2023). Because we already ignored the energy ranges of instrumental lines, we modeled the pn FWC spectrum using a bkg2pow model. We used a free constant parameter to scale the pn FWC normalization to the particle background level in the observed spectrum. The pn OoT spectrum is a highly smoothed source spectrum, which can be well fitted empirically using a bkg2pow model (see the fitting residual of the OoT spectrum in Fig. 2). The FWC spectral model was provided by Yeung et al. (2023), which is publicly available on the eROSITA DR1 site4.
Spectral model for each component.
Appendix D: Averaged surface brightness profile
We plot the azimuthally averaged surface brightness profile as well as the best-fit models in Fig. D.1.
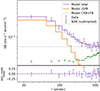 |
Fig. D.1. Azimuthally averaged surface brightness profiles (purple), subtracted NXB (green), and best-fit model profile (purple step). The models of the individual components, i.e., the IGrM and X-ray foreground and background, are plotted as orange steps and dotted gray lines, respectively. |
Appendix E: Morphology of Galaxy A
We note an asymmetric feature in the stellar light of galaxy A in Figure E.1, left panel. The disk is slightly warped. The residual image, after subtracting an isophotal model, enhances this feature in the south by revealing an extension toward the southwest. The isophotal model was created following the procedure described in Kluge & Bender (2023).
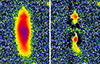 |
Fig. E.1. Cutout of the Legacy Surveys g-band image around galaxy A (left) and residual after subtracting an isophotal model. North is up; east is left. |
All Tables
All Figures
|
Fig. 1. Multi-wavelength image of the Cloverleaf odd radio circle system. Left: DESI Legacy Survey DR10 optical (white to yellow), XMM-Newton X-ray (blue), and ASKAP radio continuum (red) composite image of the Cloverleaf ORC. Middle: zoomed-in views of three morphologically disturbed galaxies (A, B, C) to the east and morphologically undisturbed galaxy (D) to the west. The BCG1, located at the X-ray and radio emission peak, and another bright elliptical galaxy (BCG2) are also shown. Top right: ASKAP 856 MHz image of the Cloverleaf ORC convolved to 20 arcsec resolution. Bottom right: EPIC-pn flux image in the 0.5−1.2 keV band. The image is source-removed and smoothed by a 20″ Gaussian kernel. Overlaid is the radio ASKAP contour of the Cloverleaf ORC (Koribalski et al., in prep.). |
| In the text | |
|
Fig. 2. XMM-Newton spectrum of the Cloverleaf ORC is shown in black in the top panel. The best-fit two-temperature IGrM model is shown as blue and orange, while the foreground and background models are plotted as dashed lines. The bottom panels indicate good fits after the background modeling, including NXB with the foreground modeling of the eRASS1 data. |
| In the text | |
|
Fig. 3. Line-of-sight velocity structures of galaxies with zspec data within 30′ angular distance. The dashed contour is the boundary of the radio emission. The inset is the histogram of ΔV. |
| In the text | |
|
Fig. 4. Diagram of radio power vs. halo mass for the samples of radio relics (Jones et al. 2023) and central radio galaxies (Pasini et al. 2022) observed by LOFAR and the Cloverleaf ORC. The power of the Cloverleaf ORC is converted to the frequency of 150 MHz by assuming a α = 1 spectral index. The error bar of the Cloverleaf ORC radio power is within the mark. |
| In the text | |
|
Fig. D.1. Azimuthally averaged surface brightness profiles (purple), subtracted NXB (green), and best-fit model profile (purple step). The models of the individual components, i.e., the IGrM and X-ray foreground and background, are plotted as orange steps and dotted gray lines, respectively. |
| In the text | |
|
Fig. E.1. Cutout of the Legacy Surveys g-band image around galaxy A (left) and residual after subtracting an isophotal model. North is up; east is left. |
| In the text | |
Current usage metrics show cumulative count of Article Views (full-text article views including HTML views, PDF and ePub downloads, according to the available data) and Abstracts Views on Vision4Press platform.
Data correspond to usage on the plateform after 2015. The current usage metrics is available 48-96 hours after online publication and is updated daily on week days.
Initial download of the metrics may take a while.