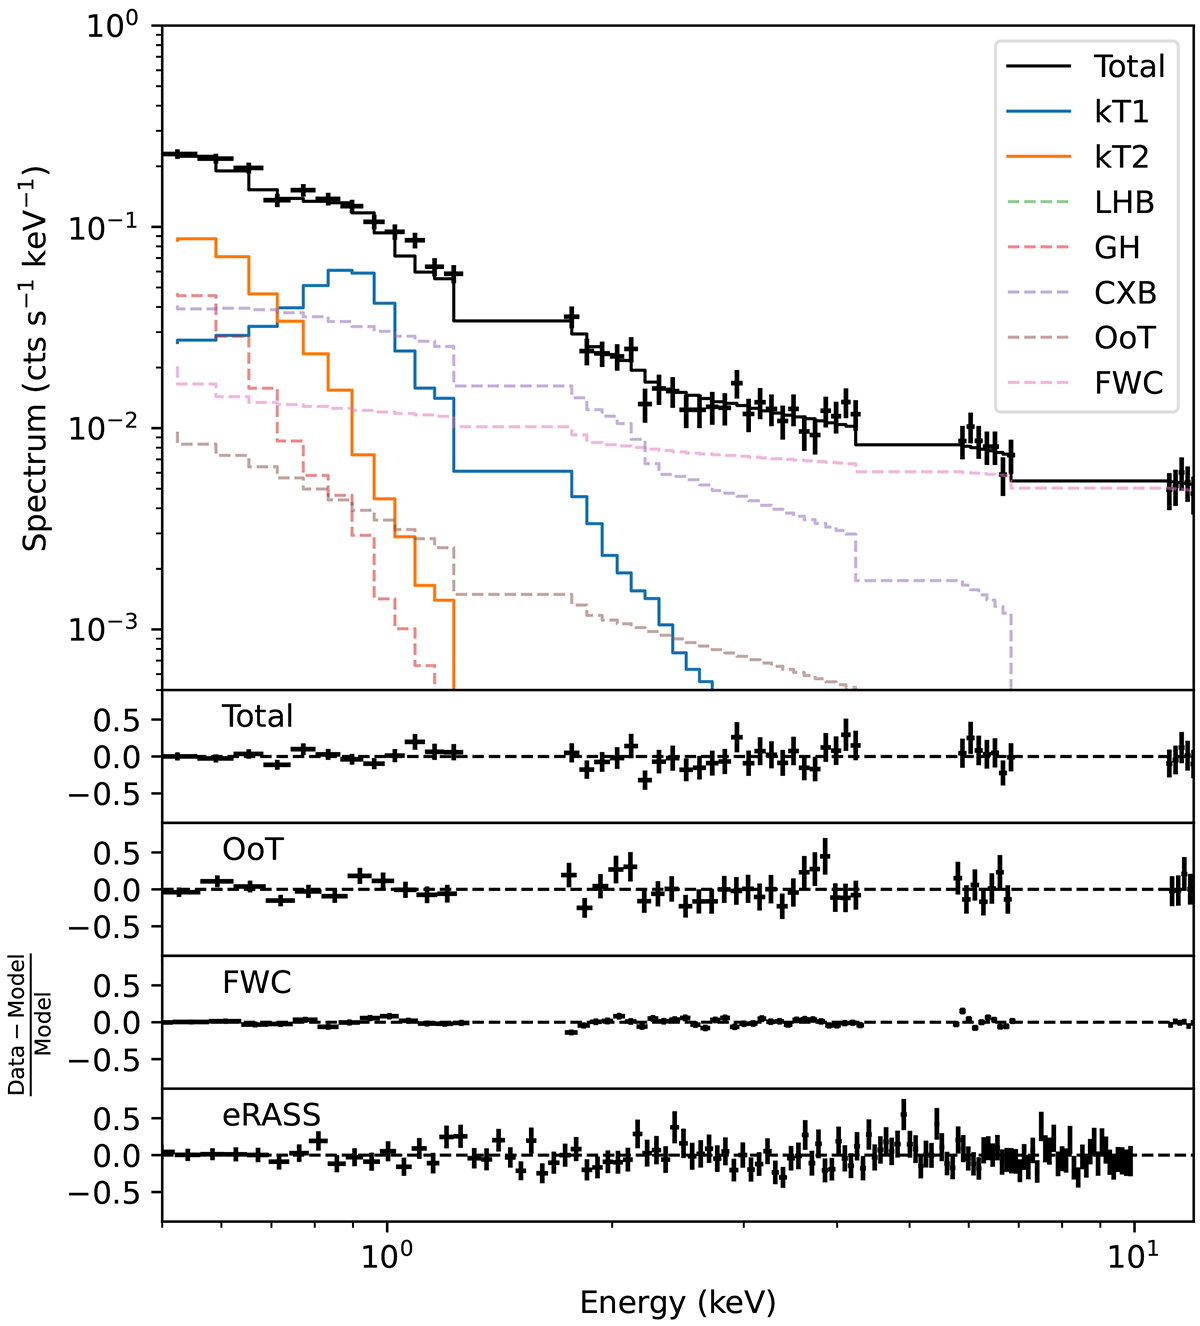
Fig. 2.
Download original image
XMM-Newton spectrum of the Cloverleaf ORC is shown in black in the top panel. The best-fit two-temperature IGrM model is shown as blue and orange, while the foreground and background models are plotted as dashed lines. The bottom panels indicate good fits after the background modeling, including NXB with the foreground modeling of the eRASS1 data.
Current usage metrics show cumulative count of Article Views (full-text article views including HTML views, PDF and ePub downloads, according to the available data) and Abstracts Views on Vision4Press platform.
Data correspond to usage on the plateform after 2015. The current usage metrics is available 48-96 hours after online publication and is updated daily on week days.
Initial download of the metrics may take a while.