Fig. 6.
Download original image
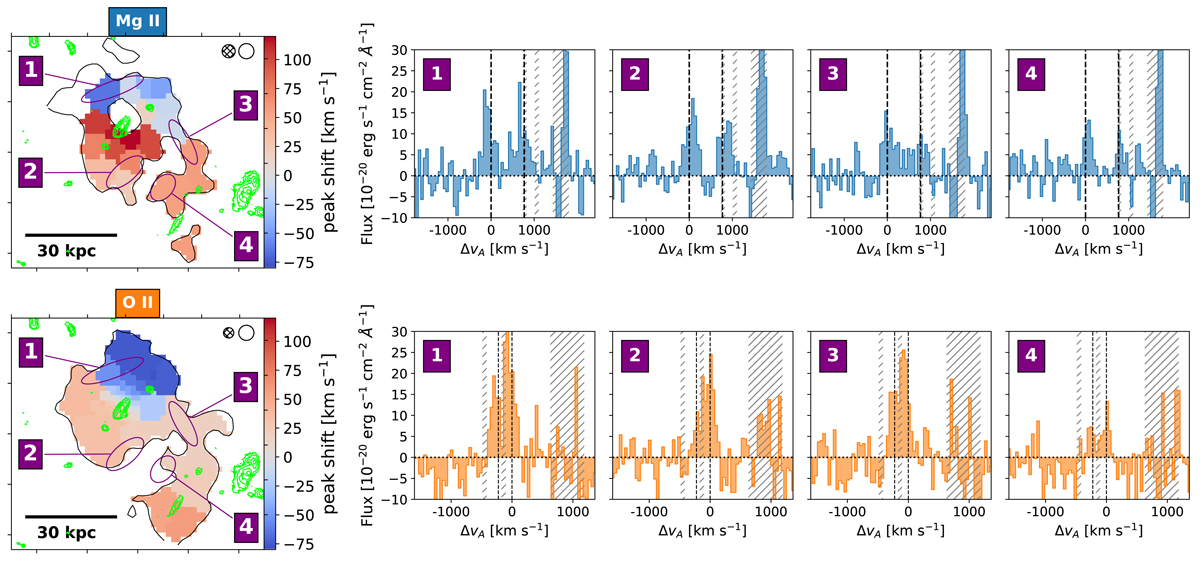
Spatially resolved Mg II and [O II] properties. Left: binned line-of-sight velocity maps of the Mg II (top) and [O II] (bottom) emission relative to the systemic redshift of galaxy A (Sects. 4.4 and 5.1). The black contours correspond to the 1.5σ significance level. The green contours trace the galaxies detected in the HST/ACS F775W image. The FWHM of the MUSE PSF and smoothing kernel are shown with a hatched and an empty circle, respectively, at the top right of the panels. The diverging Mg II and [O II] colormaps are centered on the systemic redshift of galaxy A and have the same dynamical range to ease the visual comparison (Sect. 5.1). Right: Mg II (top) and [O II] (bottom panels) doublet extracted in the elliptical areas traced in purple and designated by the same number on the map (left panels). The vertical dashed lines correspond to the systemic redshift of galaxy A. The vertical hatched bands indicate the presence of sky lines.
Current usage metrics show cumulative count of Article Views (full-text article views including HTML views, PDF and ePub downloads, according to the available data) and Abstracts Views on Vision4Press platform.
Data correspond to usage on the plateform after 2015. The current usage metrics is available 48-96 hours after online publication and is updated daily on week days.
Initial download of the metrics may take a while.