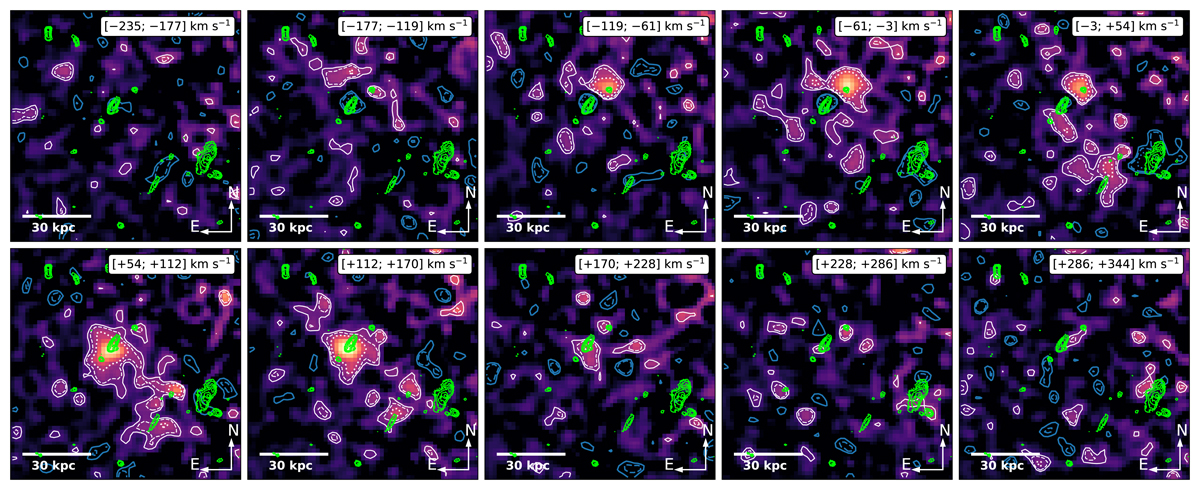
Fig. 4.
Download original image
Channel maps around the Mg IIλ2796 emission. Each map corresponds to one MUSE subcube slice (1.25 Å or 58 km s−1 at the redshift of the group). The velocity window relative to the systemic redshift of galaxy A is indicated on each panel. Contours are the same as in Fig. 3a. The eight central slices (from −177 to +286 km s−1) are summed to create the optimized λ2796 Mg II NB image shown in Fig. 3a (see Sect. 4.1).
Current usage metrics show cumulative count of Article Views (full-text article views including HTML views, PDF and ePub downloads, according to the available data) and Abstracts Views on Vision4Press platform.
Data correspond to usage on the plateform after 2015. The current usage metrics is available 48-96 hours after online publication and is updated daily on week days.
Initial download of the metrics may take a while.