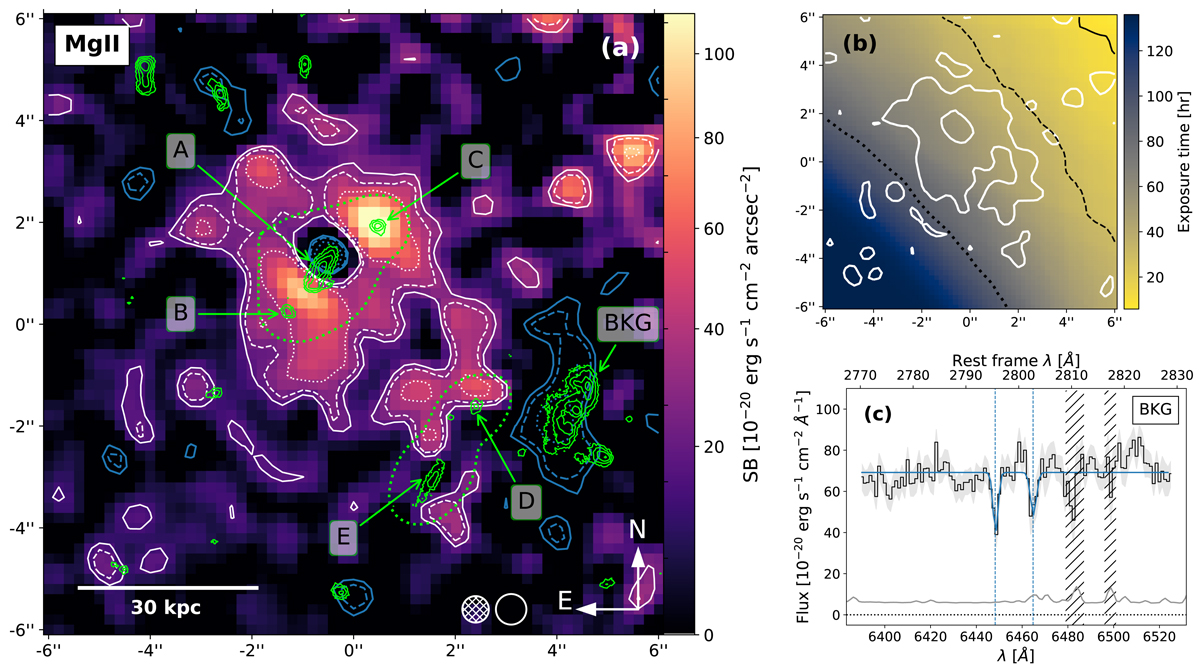
Fig. 3.
Download original image
Metal-enriched intragroup medium revealed by MUSE. (a) Mg II narrow-band image of the group (see Sect. 4.1) smoothed with a 0.6″ FWHM Gaussian and plotted with a power-law stretch. The white contours correspond to Mg II significance levels of 1.5, 2 and 3σ (solid, dashed, and dotted, respectively) where 1σ corresponds to a SB level of 1 × 10⁻¹⁹ erg s−1 cm−2 arcsec−2. The blue contours indicate the negative SB values (same coding as the positive contours) corresponding to the absorbing regions (see Sect. 4.2). The green contours trace the continuum of the group members close to Mg II and the neighboring galaxies as detected in the HST/ACS F775W image. The dotted green contour corresponds to the outer HST continuum contours of the group members set at the MUSE resolution. The FWHM of the MUSE PSF and smoothing kernel are shown with a hatched and empty circle, respectively, at the bottom-right of the figure. (b) Exposure map centered on the group. The solid, dashed, and dotted black contours indicate 10, 30, and 90 h depth, respectively. The white contour corresponds to the Mg II significance level of 1.5σ. (c) Mg II absorption in the spectrum of the background galaxy BKG located at an impact parameter of 19 kpc from galaxy D in projection and at the nebula redshift. The blue line is the best-fit model of the Mg II doublet absorption (Sect. 4.2). The 1σ uncertainties are shown in gray and the hatched areas indicate the position of strong sky lines and noise peaks. The systemic redshift of galaxy D is indicated by vertical dashed lines.
Current usage metrics show cumulative count of Article Views (full-text article views including HTML views, PDF and ePub downloads, according to the available data) and Abstracts Views on Vision4Press platform.
Data correspond to usage on the plateform after 2015. The current usage metrics is available 48-96 hours after online publication and is updated daily on week days.
Initial download of the metrics may take a while.