Fig. 2.
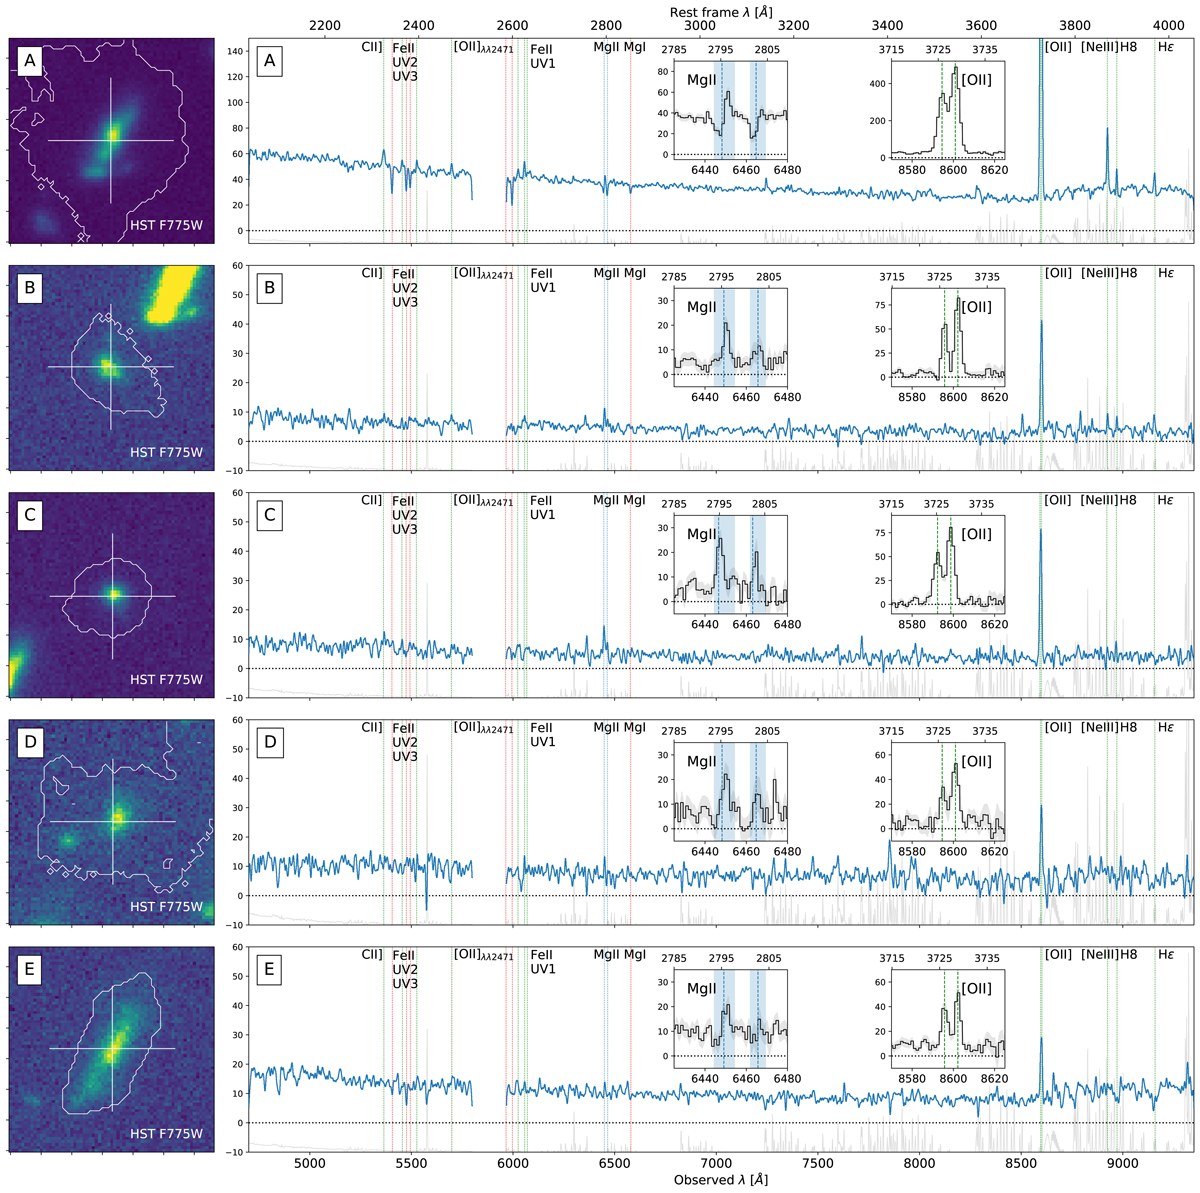
Download original image
Integrated spectra of the five group members. Left: 2″ × 2″ HST/ACS F775W images of the five group members. The central white cross and contour indicate the HST coordinates and segmentation map from Rafelski et al. (2015). Right: integrated spectrum (units of 10−20 erg s−1 cm−2 Å−1) of the galaxy shown in the corresponding left panel extracted within the HST segmentation map contour using the ODHIN software (Bacher 2017, see Sect. 3.3) and smoothed with a 7 Å FWHM Gaussian function. The positions of several emission (absorption) lines are indicated by vertical dotted green (red) lines. The gray unsmoothed spectra show the 1σ uncertainties which have been offset for readability. The unsmoothed Mg II and [O II] lines (vertical dashed lines) are shown in the insets. The vertical blue shaded areas indicate the spectral widths used to construct the Mg II NB image shown in Fig. 3a.
Current usage metrics show cumulative count of Article Views (full-text article views including HTML views, PDF and ePub downloads, according to the available data) and Abstracts Views on Vision4Press platform.
Data correspond to usage on the plateform after 2015. The current usage metrics is available 48-96 hours after online publication and is updated daily on week days.
Initial download of the metrics may take a while.