Fig. C.1.
Download original image
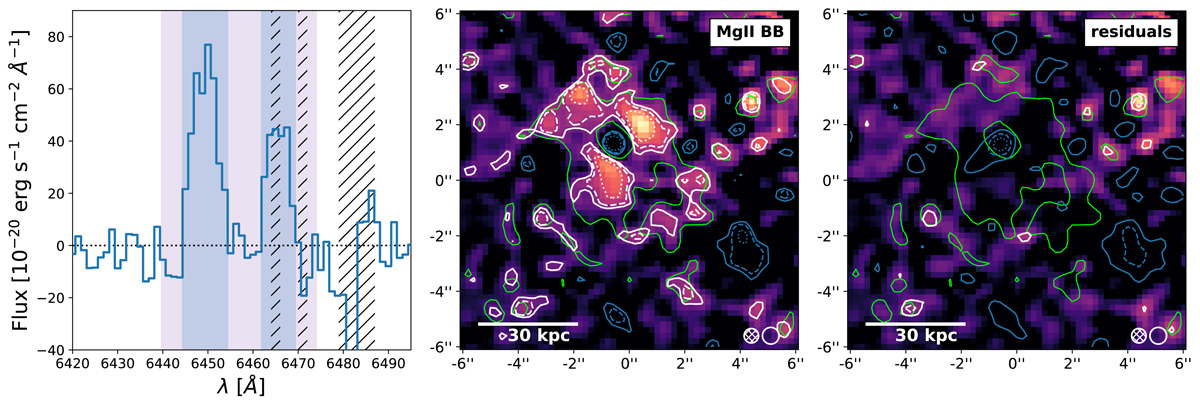
Spectral bandwidth effect on the Mg II nebula detection. Left: Mg II spectrum of the nebula integrated within the 2σ significance level contour (see Fig. 3a). The vertical blue shaded areas indicate the spectral widths used to construct the Mg II NB image shown in Fig. 3. The shaded purple area shows the wavelength band used to build the broader NB image shown in the middle panel. The hatched areas indicate the position of sky lines. Middle: Broader Mg II NB image extended by ±500 km s−1 on the λ2796 and λ2803 line outskirts (purple shaded area in the left panel) encompassing the whole Mg II spectral range (2792−2806 Å in rest frame). Right: Difference between the Mg II NB and broader band (blue and purple shaded areas in the left panel) images. The contours are the same as in Fig. 3 except that the green contour here shows the 1.5σ contour of the S/N-optimized Mg II NB image.
Current usage metrics show cumulative count of Article Views (full-text article views including HTML views, PDF and ePub downloads, according to the available data) and Abstracts Views on Vision4Press platform.
Data correspond to usage on the plateform after 2015. The current usage metrics is available 48-96 hours after online publication and is updated daily on week days.
Initial download of the metrics may take a while.