Fig. 1.
Download original image
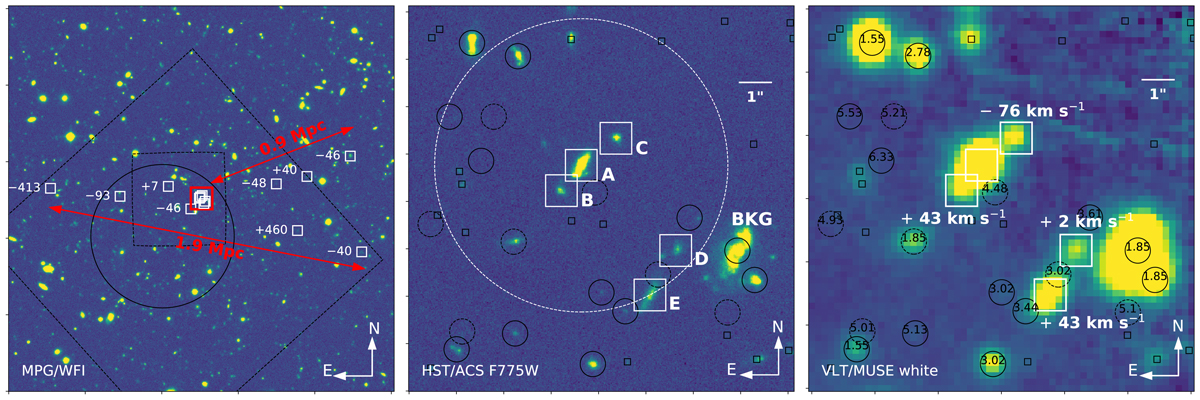
Galaxy group and its environment. Left: galaxies belonging to the same structure (see Sect. 3.1) as the galaxies embedded in the z ≈ 1.31 Mg II nebula (shown as the red square) are indicated by white squares. The velocity relative to the most massive galaxy of the group (galaxy A, see middle panel) is indicated for each galaxy in km s−1. The structure spans ≈2 Mpc in projection and the galaxies appear well aligned. A ≈1 Mpc substructure extending beyond the MUSE Deep Field (big black dashed square) is also indicated. The MXDF and udf-10 fields are shown with the solid circle and small dashed square, respectively. The background image is an MPG(ESO2.2m)/WFI image (Hildebrandt et al. 2006). Middle: zoom-in window of (12![]() 2 × 12
2 × 12![]() 2) on the five galaxies around which the Mg II nebula has been discovered. The galaxies are designated by letters where galaxy A is the most massive one (see Sect. 3.2), and the other letters (from B to E) are attributed to galaxies depending on their projected distance to galaxy A (from the closest to the furthest). The white circle is centered on galaxy A and has a radius of 40 kpc (≈5″). The background image is the HST/ACS F775W image. The galaxies in the Rafelski et al. (2015) HST catalog without a MUSE redshift are indicated by the small black squares. The spectroscopic MUSE redshifts with confidence 1 and > 1 (Bacon et al., in prep.; see also Inami et al. 2017) are indicated as black dashed and solid circles, respectively. The redshift values are indicated on the right panel. The label “BKG” points at a bright background galaxy acting as a sightline for absorption line studies of the Mg II nebula (see Sect. 4.2). Right: same spatial window as the middle panel showing the MUSE white light image of the group (white squares) and its surrounding. The positions of the galaxies B, C, D and E relative to galaxy A in velocity space are indicated in white. The redshift measurement procedure of the group members is described in Sect. 3.3.
2) on the five galaxies around which the Mg II nebula has been discovered. The galaxies are designated by letters where galaxy A is the most massive one (see Sect. 3.2), and the other letters (from B to E) are attributed to galaxies depending on their projected distance to galaxy A (from the closest to the furthest). The white circle is centered on galaxy A and has a radius of 40 kpc (≈5″). The background image is the HST/ACS F775W image. The galaxies in the Rafelski et al. (2015) HST catalog without a MUSE redshift are indicated by the small black squares. The spectroscopic MUSE redshifts with confidence 1 and > 1 (Bacon et al., in prep.; see also Inami et al. 2017) are indicated as black dashed and solid circles, respectively. The redshift values are indicated on the right panel. The label “BKG” points at a bright background galaxy acting as a sightline for absorption line studies of the Mg II nebula (see Sect. 4.2). Right: same spatial window as the middle panel showing the MUSE white light image of the group (white squares) and its surrounding. The positions of the galaxies B, C, D and E relative to galaxy A in velocity space are indicated in white. The redshift measurement procedure of the group members is described in Sect. 3.3.
Current usage metrics show cumulative count of Article Views (full-text article views including HTML views, PDF and ePub downloads, according to the available data) and Abstracts Views on Vision4Press platform.
Data correspond to usage on the plateform after 2015. The current usage metrics is available 48-96 hours after online publication and is updated daily on week days.
Initial download of the metrics may take a while.