Fig. 8
Download original image
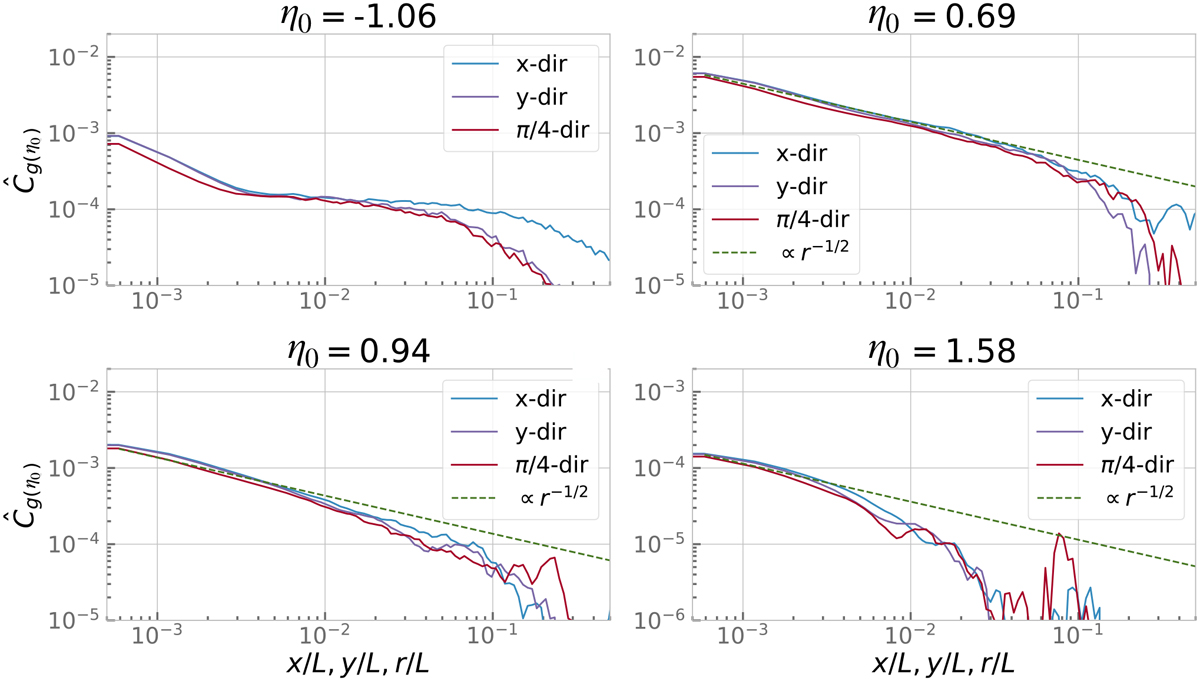
Estimated ACF of the field ɡη0(y) for different values of ŋ0 = ŋ in 3 different directions. Blue, purple and red lines represent respectively the x, y and π/4 (x = y) directions. Two top panels are for ŋ0 = −1.06 and 0.69, whereas the two bottom panels are for ŋ0 = 0.94 and 1.58. At low column-densities (η0 = −1.06), a strong anisotropy is detected in the x-direction and becomes noticeable at x/L ≥ 2 × 10⁻² as was the case for the column-density ACF (see Fig. 7). For high column-densities (η0 > 0), however, the anisotropy is subdued and the ACFs are fairly isotropic at small scales up to x/L, r/L ~ 10–1 where the data become quite noisy. Green dashed lines show the profile of an isotropic ACF proportional to r–1/2 that matches the data at short scales fairly well, at least over a decade.
Current usage metrics show cumulative count of Article Views (full-text article views including HTML views, PDF and ePub downloads, according to the available data) and Abstracts Views on Vision4Press platform.
Data correspond to usage on the plateform after 2015. The current usage metrics is available 48-96 hours after online publication and is updated daily on week days.
Initial download of the metrics may take a while.