Fig. 7
Download original image
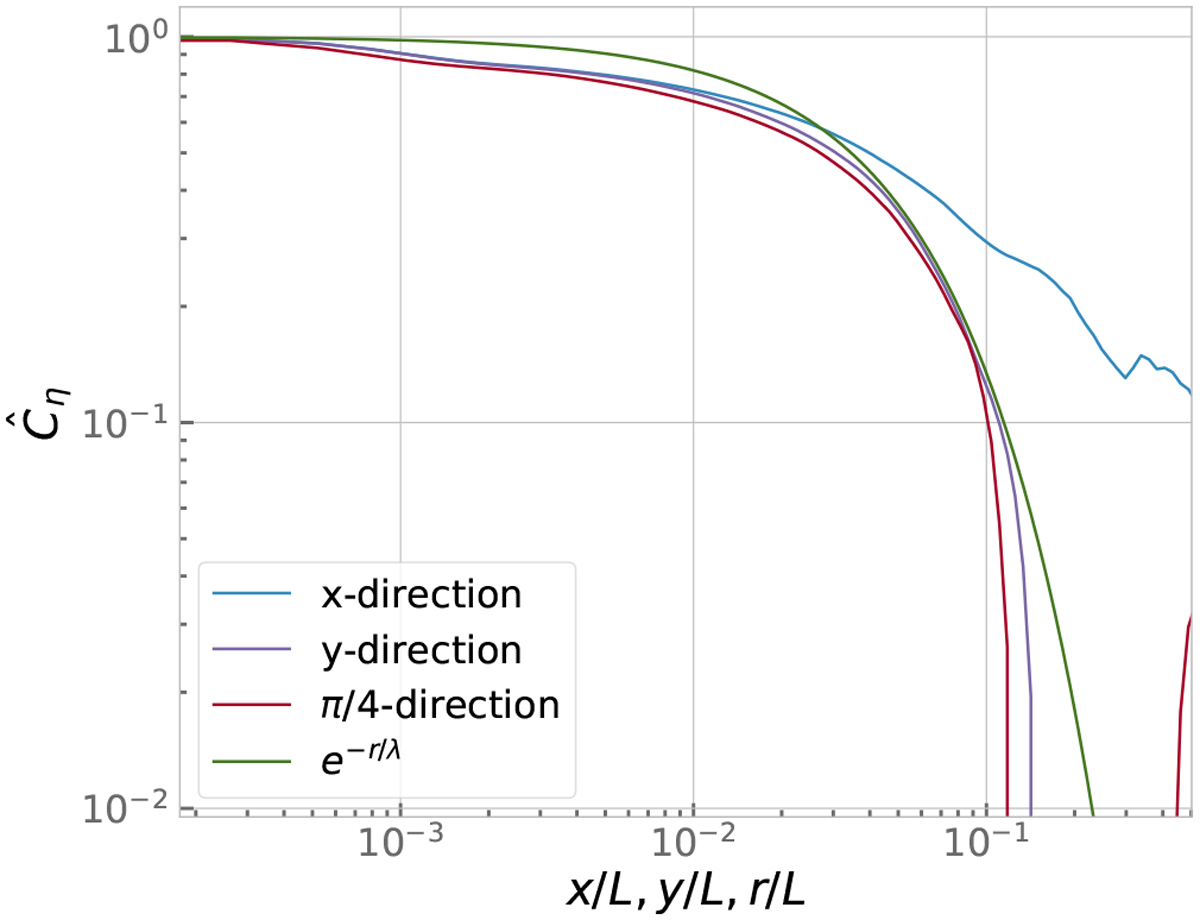
Reduced ACF of the low pass Altered map in three different directions. Blue line: x-direction (y = 0). Purple line: y-direction (x = 0). Red line: π/4 or x = y-direction. Green line: exponential pro Ale giving an estimate of the rate of decay (here λ/L 5 × 10⁻²). A strong anisotropy is present in the x direction at large scales (x/L ≥ 2 × 10⁻²).
Current usage metrics show cumulative count of Article Views (full-text article views including HTML views, PDF and ePub downloads, according to the available data) and Abstracts Views on Vision4Press platform.
Data correspond to usage on the plateform after 2015. The current usage metrics is available 48-96 hours after online publication and is updated daily on week days.
Initial download of the metrics may take a while.