Open Access
Fig. C.3
Download original image
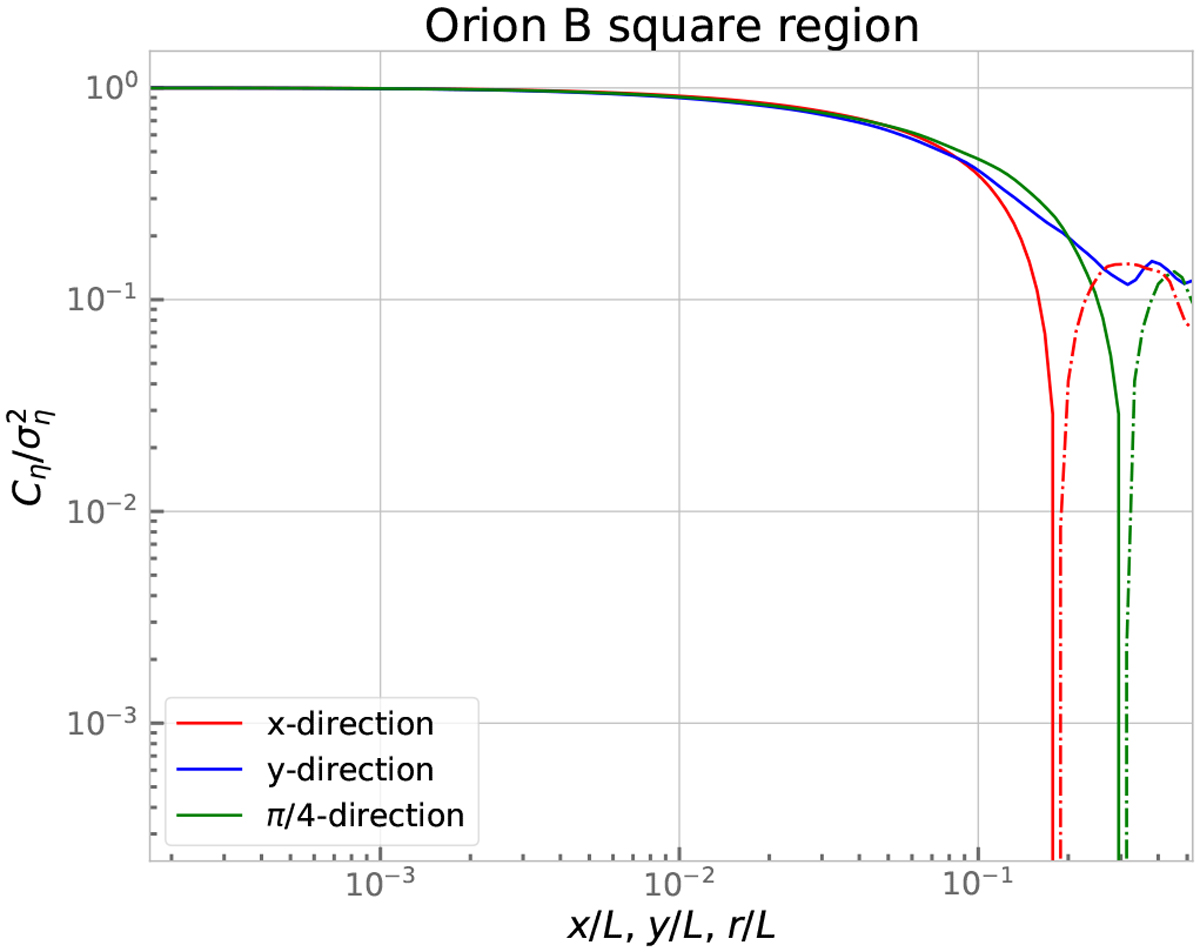
Reduced ACF of the low pass filtered map in three different directions. Red line: x-direction (y = 0). Blue line: y-direction (x = 0). Green line: π/4 or x = y-direction. Dash dotted lines represent the values of the ACF when it is negative. A strong anisotropy is present in the y direction at large scales (y/L ≥ 10–1).
Current usage metrics show cumulative count of Article Views (full-text article views including HTML views, PDF and ePub downloads, according to the available data) and Abstracts Views on Vision4Press platform.
Data correspond to usage on the plateform after 2015. The current usage metrics is available 48-96 hours after online publication and is updated daily on week days.
Initial download of the metrics may take a while.