Fig. 11

Download original image
Shadded regions bounded by the two estimates ![]() and
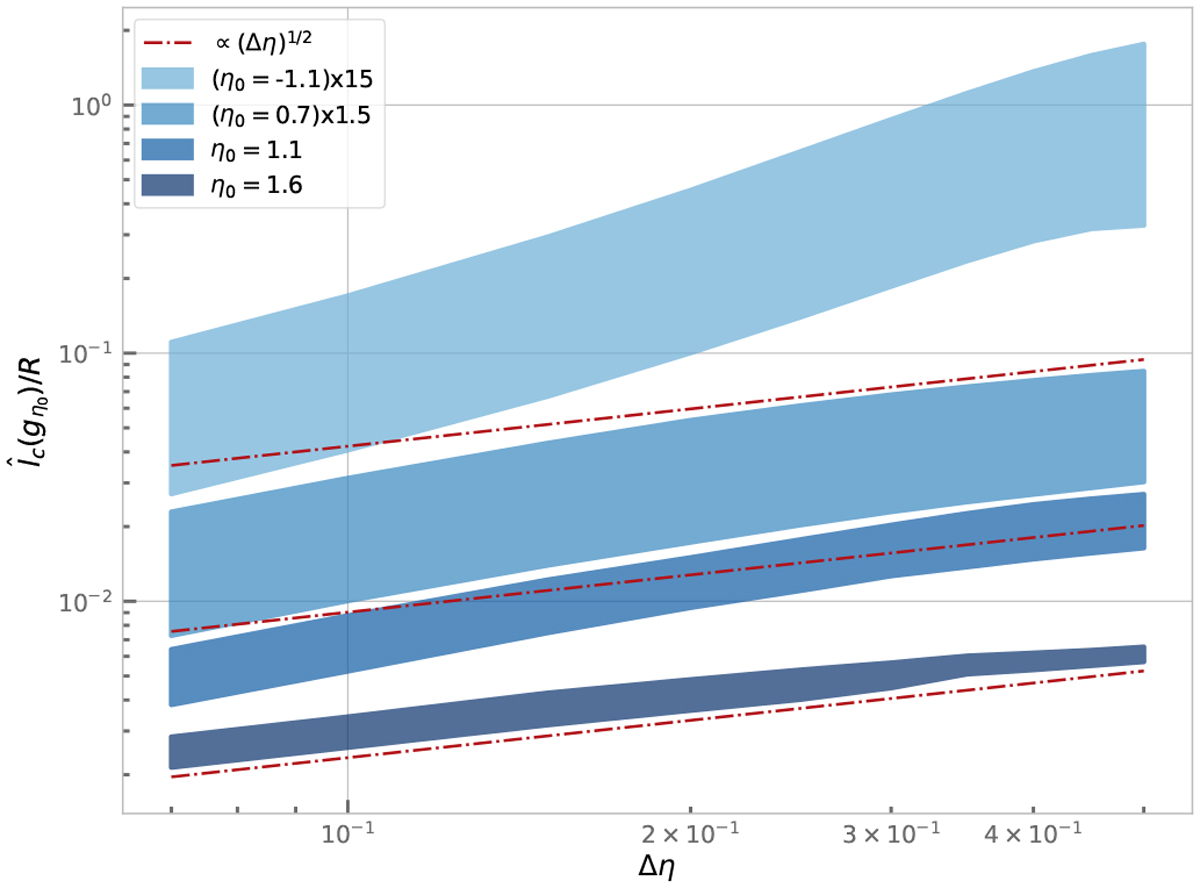
and ![]() for different bin sizes Δη at four values of η0 = −1.1, 0.7, 1.1, 1.6 from light to dark blue respectively. For clarity the values of the estimates for η0 = −1.1 and η0 = 0.7 were multiplied by 15 and 1.5 to shift their curves upward. Red dash-dotted lines indicate a scaling ∝ (Δη)1/2. At positive density contrasts ŋ > 0 the estimates follow a scaling close to the predicted
for different bin sizes Δη at four values of η0 = −1.1, 0.7, 1.1, 1.6 from light to dark blue respectively. For clarity the values of the estimates for η0 = −1.1 and η0 = 0.7 were multiplied by 15 and 1.5 to shift their curves upward. Red dash-dotted lines indicate a scaling ∝ (Δη)1/2. At positive density contrasts ŋ > 0 the estimates follow a scaling close to the predicted ![]() .
.
Current usage metrics show cumulative count of Article Views (full-text article views including HTML views, PDF and ePub downloads, according to the available data) and Abstracts Views on Vision4Press platform.
Data correspond to usage on the plateform after 2015. The current usage metrics is available 48-96 hours after online publication and is updated daily on week days.
Initial download of the metrics may take a while.


