Fig. 6.
Download original image
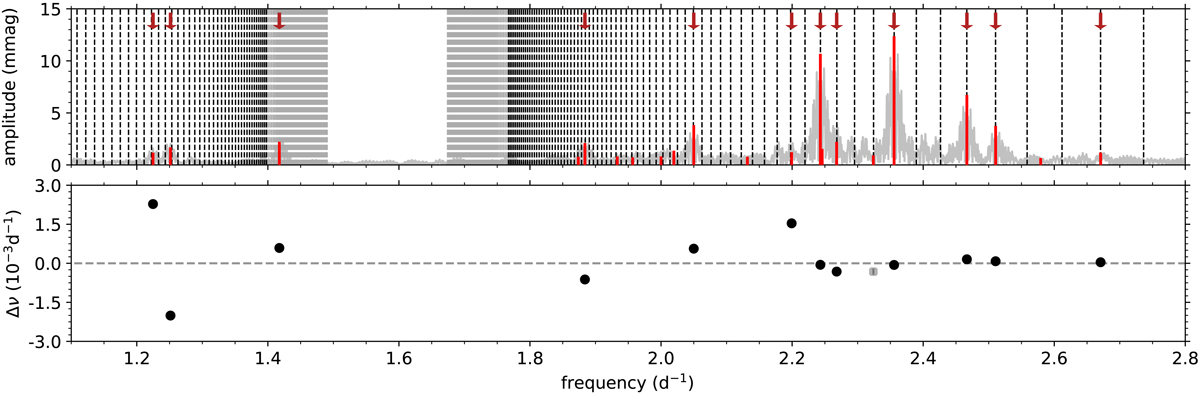
Comparison of the observed pulsation frequencies and the best-fitting model. Top: Lomb-Scargle periodogram of the complete light curve (light grey) with the prewhitened pulsation frequencies with S/N ≥ 4.0 (full red lines) and dark red arrows marking the frequencies with S/N ≥ 5.6. The best-fitting asymptotic g-mode patterns (dashed lines) for the r modes (left) and the prograde dipole modes (right) are also shown. The parts of the theoretical patterns that cannot be resolved properly (where the spacing Δν between consecutive frequencies is less than twice the frequency resolution νres are shown by the grey dashed lines. Bottom: the residuals (black) of the modelled observed frequencies, and the differences (grey) between the remaining observed frequencies and the closest model frequencies. G modes with 4.0 ≤ S/N < 5.6 that are not shown in the bottom panel, lie outside of the plotted range.
Current usage metrics show cumulative count of Article Views (full-text article views including HTML views, PDF and ePub downloads, according to the available data) and Abstracts Views on Vision4Press platform.
Data correspond to usage on the plateform after 2015. The current usage metrics is available 48-96 hours after online publication and is updated daily on week days.
Initial download of the metrics may take a while.