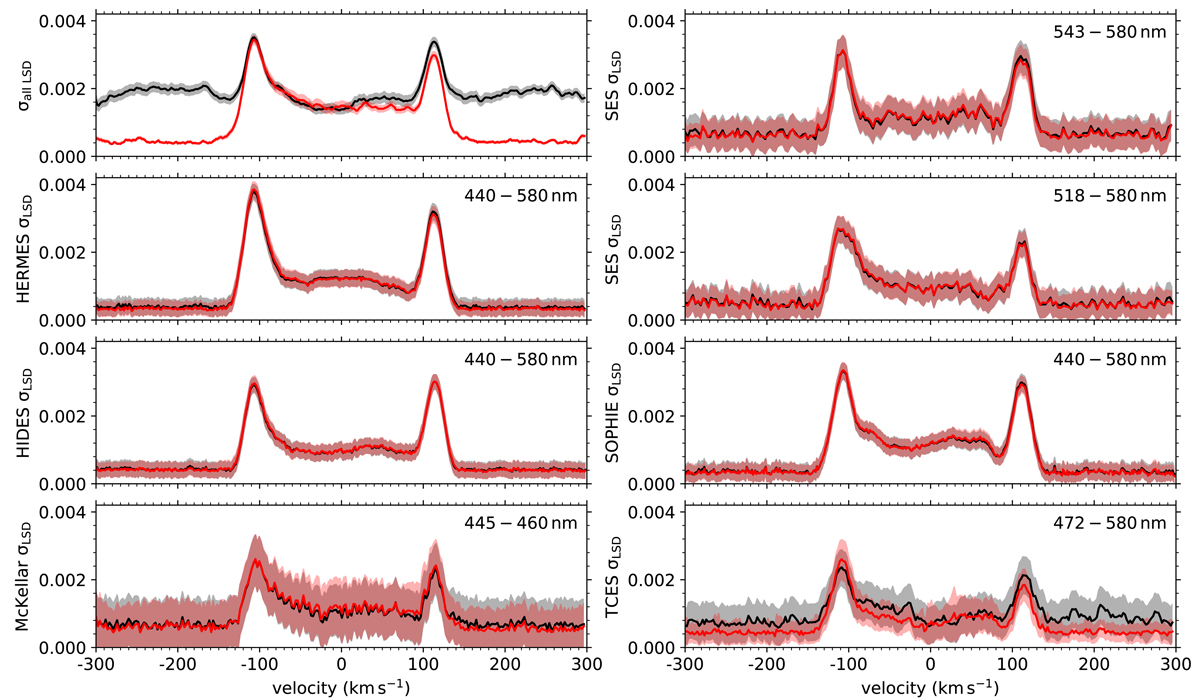
Fig. 4.
Download original image
Standard deviations σ for the LSD profiles, both for the entire data set (top left panel) and per spectrograph (other panels), calculated before (black) and after (red) the renormalisation of the LSD profiles. The coloured areas indicate the 1-σ uncertainties, which were calculated with Monte Carlo simulations. The wavelength ranges used for the LSD calculations are given in the top right corners.
Current usage metrics show cumulative count of Article Views (full-text article views including HTML views, PDF and ePub downloads, according to the available data) and Abstracts Views on Vision4Press platform.
Data correspond to usage on the plateform after 2015. The current usage metrics is available 48-96 hours after online publication and is updated daily on week days.
Initial download of the metrics may take a while.