Fig. 2.
Download original image
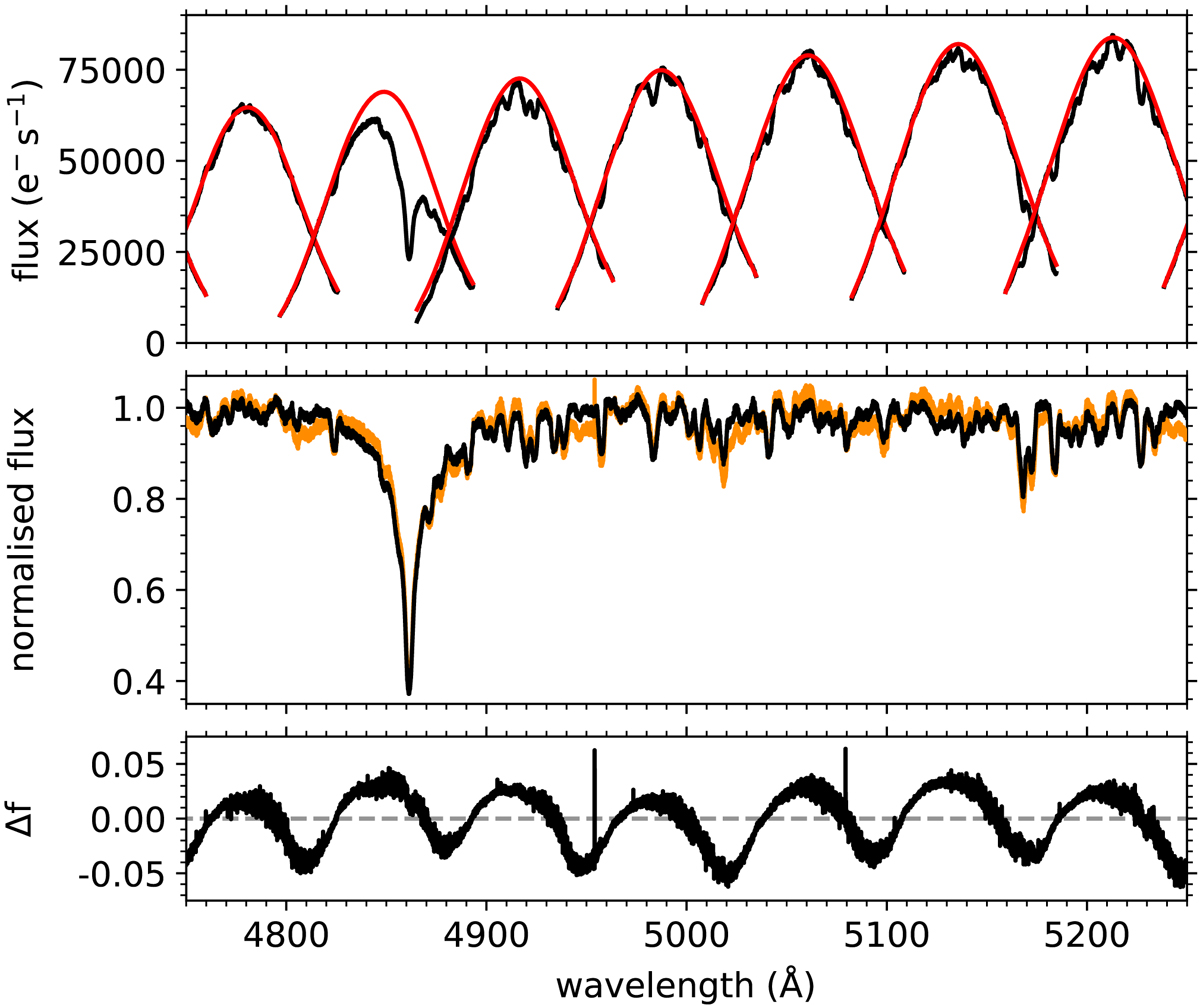
Normalisation of the SOPHIE spectrum taken at BJD 2454828.69749. Top: the pipeline-reduced individual spectral orders (black) and the best-fitting scaled blaze functions (red) defined in Eqs. (1) and (2). Middle: our normalised and merged spectrum (black) compared with the normalised one-dimensional spectrum from the SOPHIE pipeline (orange). Bottom: the difference between the two normalised spectra shown in the middle panel. The residual instrumental trends from the one-dimensional pipeline-reduced spectrum dominate.
Current usage metrics show cumulative count of Article Views (full-text article views including HTML views, PDF and ePub downloads, according to the available data) and Abstracts Views on Vision4Press platform.
Data correspond to usage on the plateform after 2015. The current usage metrics is available 48-96 hours after online publication and is updated daily on week days.
Initial download of the metrics may take a while.