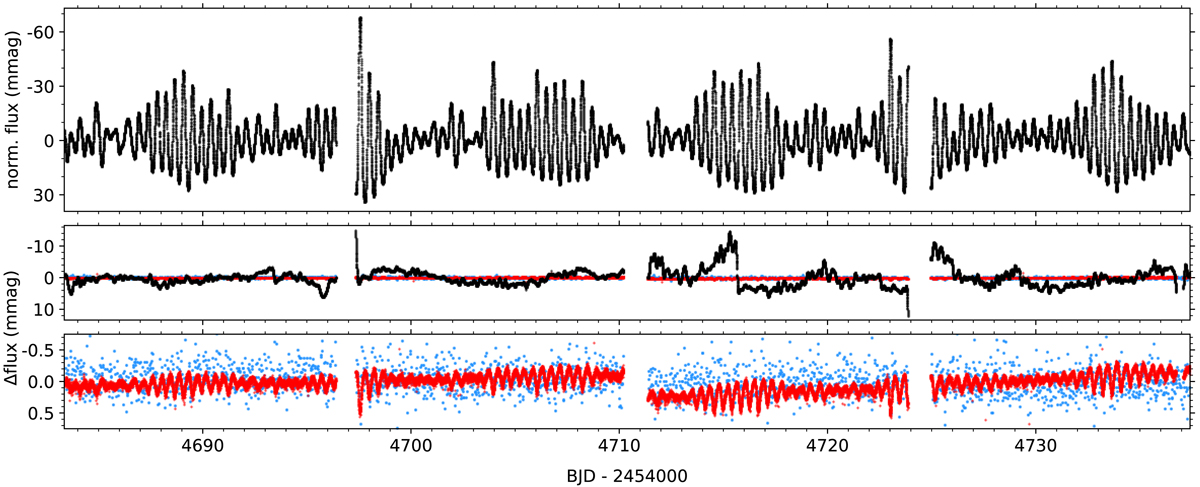
Fig. 1.
Download original image
Comparison of different reduced TESS light curves of HD 112429. Top: custom reduced short-cadence light curve, illustrated for sectors 14 and 15. The gaps in the light curve are caused by the data downlinks of TESS. Middle: absolute differences between our custom reduced light curve and the FFI lightcurve (blue), TESS-SPOC SAP flux (red) and PDC-SAP flux (black). Bottom: zoom-in of absolute differences between our custom reduced light curve and the FFI lightcurve (blue) and TESS-SPOC SAP flux (red).
Current usage metrics show cumulative count of Article Views (full-text article views including HTML views, PDF and ePub downloads, according to the available data) and Abstracts Views on Vision4Press platform.
Data correspond to usage on the plateform after 2015. The current usage metrics is available 48-96 hours after online publication and is updated daily on week days.
Initial download of the metrics may take a while.