| Issue |
A&A
Volume 661, May 2022
|
|
|---|---|---|
| Article Number | A153 | |
| Number of page(s) | 7 | |
| Section | Stellar atmospheres | |
| DOI | https://doi.org/10.1051/0004-6361/202142889 | |
| Published online | 26 May 2022 | |
Discovery of a thin lithium plateau among metal-poor red giant branch stars★,★★
1
Dipartimento di Fisica e Astronomia, Università degli Studi di Bologna,
Via Gobetti 93/2,
40129
Bologna,
Italy
e-mail: This email address is being protected from spambots. You need JavaScript enabled to view it.
2
INAF – Osservatorio di Astrofisica e Scienza dello Spazio di Bologna,
Via Gobetti 93/3,
40129
Bologna,
Italy
3
Departamento de Ciencias Fisicas, Universidad Andres Bello,
Fernandez Concha 700,
Las Condes,
Santiago,
Chile
4
GEPI, Observatoire de Paris, Université PSL, CNRS,
Place Jules Janssen,
92195
Meudon,
France
5
Astrophysics Research Institute, Liverpool John Moores University,
146 Brownlow Hill,
Liverpool
L3 5RF,
UK
6
INAF – Osservatorio Astronomico d’Abruzzo,
Via M. Maggini,
64100
Teramo,
Italy
7
Instituto de Astrofísica e Ciências do Espaço, Universidade do Porto, CAUP,
Rua das Estrelas,
4150-762
Porto,
Portugal
8
Laboratoire Univers et Particules de Montpellier, Université de Montpellier, CNRS,
Place Eugène Bataillon,
34095
Montpellier,
France
Received:
11
December
2021
Accepted:
18
March
2022
Abstract
The surface lithium abundance, A(Li), of warm metal-poor dwarf stars exhibits a narrow plateau down to [Fe/H] ~ −2.8 dex, while at lower metallicities the average value drops by 0.3 dex with a significant star-by-star scatter (called ‘lithium meltdown’). This behaviour is in conflict with predictions of standard stellar evolution models calculated with the initial A(Li) provided by the standard Big Bang nucleosynthesis. The lower red giant branch (LRGB) stars provide a complementary tool to understand the initial A(Li) distribution in metal-poor stars. We have collected a sample of high-resolution spectra of 58 LRGB stars spanning a range of [Fe/H] between ~−7.0 dex and ~−1.3 dex. The LRGB stars display an A(Li) distribution that is clearly different from that of the dwarfs, without signatures of a meltdown and with two distinct components: (a) a thin A(Li) plateau with an average A(Li) = 1.09 ± 0.01 dex (σ= 0.07 dex) and (b) a small fraction of Li-poor stars with A(Li) lower than ~0.7 dex. The A(Li) distribution observed in LRGB stars can be reconciled with an initial abundance close to the cosmological value by including an additional chemical element transport in stellar evolution models. The required efficiency of this transport allows us to also match the Spite plateau lithium abundance measured in the dwarfs. The emerging scenario is that all metal-poor stars formed with the same initial A(Li), but those that are likely the product of coalescence or that experienced binary mass transfer show lower A(Li). We conclude that the A(Li) in LRGB stars is qualitatively compatible with the cosmological A(Li) value and that the meltdown observed in dwarf stars does not reflect a real drop in the abundance at birth.
Key words: stars: abundances / techniques: spectroscopic / Galaxy: abundances
Full Table 2 is only available at the CDS via anonymous ftp to cdsarc.u-strasbg.fr (130.79.128.5) or via http://cdsarc.u-strasbg.fr/viz-bin/cat/J/A+A/661/A153
Based on observations collected at the ESO-VLT under programmes 68.D-0546, 69.D-0065, 70.D-0009, 71.B-0529, 072.B-0585, 074.B-0639, 076.D-0451, 078.B-0238, 090.B-0605, 092.D-0742, 099.D-0287, 0103.D-0310, 0104.B-0487, 0104.D-0059, 165.N-0276, 169.D-0473, 170.D-0010, 281.D-5015, and 380.D-0040, at the La Silla Observatory under the programme 60.A-9700, at the Magellan telescope under programmes CN2017A-33 and CN2017B-54, and on data available in the ELODIE archive.
© ESO 2022
1 Introduction
After about four decades, the distribution of the surface lithium abundance, A(Li)1, in Galactic halo dwarf stars still poses a challenge to stellar evolution models. Stars with effective temperature (Teff) above ~5600 K and [Fe/H] between ~−2.8 dex and ~−1.0 dex display a constant level of surface lithium abundance (A(Li) ~ 2.1–2.3 dex, the exact value depending on the adopted Teff scale) with a very small dispersion, the so-called Spite plateau (Spite & Spite 1982). Initially interpreted as the primordial Li abundance synthesised during the Big Bang, this abundance level was later found to be three to four times lower than the predictions of standard Big Bang nucleosynthesis (SBBN) for the baryon-to-photon ratio determined by the WMAP and Planck satellites (see Coc et al. 2014, and references therein). This discrepancy is often referred to as the ‘cosmological lithium problem’, and solutions were searched for along different routes, including nuclear physics, stellar physics, and modifications to the SBBN (see Spite et al. 2012, for a review).
Observations later showed that the Spite plateau crumbles below [Fe/H] ~ −2.8 dex (Asplund et al. 2006; Bonifacio et al. 2007; Aoki et al. 2009; Sbordone et al. 2010; Aguado et al. 2019). At these metallicities, the mean A(Li) in warm dwarfs progressively decreases and the abundance dispersion becomes substantial, although three stars with Spite plateau abundances have been observed (Bonifacio et al. 2018; Aguado et al. 2019). This drop in the mean A(Li) is usually called ‘lithium meltdown’, and its origin is still unclear. It may be the signature of an inhomogeneous interstellar medium and varying levels of processing of primordial material by massive stars in the early universe, but it may also arise from depletion mechanisms inside the star or at the stellar surface acting differently in this metallicity regime than at higher [Fe/H].
The observed behaviour of A(Li) with [Fe/H] is problematic for standard stellar models that include convection and atomic diffusion (taking radiative accelerations into account) as the only element transport mechanisms. The effect of atomic diffusion on the surface chemical composition is metallicity-dependent, becoming at a given age more efficient at lower metallicity where turn-off stars have a higher Teff because of the thinner (in mass) outer convective layers. This means that, assuming the same initial A(Li) for all metal-poor stars, the surface A(Li) during the main sequence (MS) evolution should progressively decrease with decreasing initial [Fe/H] and also increasing Teff at constant initial [Fe/H], at variance with the measured uniform A(Li).
The situation is further complicated by the fact that atomic diffusion is predicted to also deplete the surface [Fe/H] during the MS evolution of these objects for initial [Fe/H] higher than ~−2.3 dex, and increase it for lower initial [Fe/H] due to the selective effect of radiative accelerations (Richard et al. 2002). At any rate, a Li abundance plateau as a function of the actual [Fe/H] is not predicted by stellar models that include fully efficient atomic diffusion.
A natural inference from this discrepancy is that some additional element transport mechanism should occur during the MS evolution to counterbalance the effect of atomic diffusion and create a plateau for actual [Fe/H] values above ~−2.8 dex. This inference is also confirmed by the very similar abundances of various heavy elements measured in dwarf and red giant branch (RGB) stars of some Galactic globular clusters (see e.g. Korn et al. 2006; Mucciarelli et al. 2011).
At variance with atomic diffusion, which is a well-established process derived from first principles and without free parameters (see e.g. Michaud et al. 2015; Salaris & Cassisi 2017), there is currently no established physical description for these additional mechanisms. Mass loss (Vauclair & Charbonnel 1995; Vick et al. 2013) or rotation-induced mixing and penetrative convection (Dumont et al. 2021) can modify the surface A(Li), and Deal & Martins (2021) showed that they are good candidates to explain the surface A(Li) of Population II stars. However, their modelling is still subject to sizeable uncertainties. On the other hand, Richard et al. (2002) proposed as a pragmatic solution the inclusion of a turbulent diffusion coefficient2 able to partially counteract atomic diffusion in the outer layers of models for Spite plateau stars. Depending on its efficiency, this turbulent diffusion can even transport some extra lithium down to the Li-burning region (T > 2.5 × 10⁶ K).
The added turbulent diffusion coefficient has been tuned to reproduce the measured abundances of a few metals and A(Li) in MS and sub-giant-branch stars in a handful of Galactic globular clusters (see e.g. Korn et al. 2006; Gavel et al. 2021) and the Spite plateau in field halo stars (Richard et al. 2005; Deal & Martins 2021) as well as to reconcile the measured A(Li) with the SBBN Li abundance at a level of 1−2σ (Korn 2020). However, the lack of an established physical process for this turbulence reduces the predictive power of these models. Also, these models cannot explain the meltdown observed at [Fe/H] < −2.8 dex.
A complementary view of the initial A(Li) in metal-poor stars is provided by chemical abundances in RGB stars located after the completion of the first dredge-up (FDU) and below the RGB-bump luminosity level; these stars are denoted as lower RGB (LRGB) stars. Their surface A(Li) is predicted to depend on how much Li has been left in their interiors after the MS and the maximum extension (in mass) reached by convection during the FDU. It turns out to be – for a given initial A(Li) – very weakly dependent on the efficiency of atomic diffusion during the MS, as long as no extra Li burning is caused by the process invoked to mitigate the diffusion itself (Mucciarelli et al. 2012, hereafter MSB12).
Also, the surface Fe abundance after the FDU is restored to essentially its initial value because the iron diffused from the convective envelope during the MS is almost completely re-engulfed by the deeper convective layers. Hence, values of [Fe/H] measured in LRGB stars are representative of their initial Fe content.
In this work, we present measurements of A(Li) in a sample of LRGB stars and perform two tests involving the progeny of dwarf stars on the Spite plateau and in the meltdown metallicity regime. The aims are first to establish whether the turbulent diffusive chemical transport proposed by Richard et al. (2002), once calibrated to reproduce the Spite plateau starting from the SBBN A(Li), also reproduces the A(Li) measured in LRGB stars without any additional tuning. The second aim is to assess whether LRGB stars display some signature of the meltdown observed among dwarfs. This will help in establishing whether this phenomenon is due to a real variation in the initial A(Li) or to some chemical transport process affecting the more metal-poor dwarfs.
2 The LRGB sample
We have collected a sample of high-resolution spectra of LRGB stars, combining proprietary (Program ID: 099.D-0287; PI: Mucciarelli, CN2017A-33 and CN2017B-54, PI: Monaco) and archival data. Target stars were selected starting from the SAGA database (Suda et al. 2008) and previous works focused on metal-poor giant stars (MSB12, Spite et al. 2005; Yong et al. 2013; Roederer et al. 2014).
The final choice of the targets is based on our homogeneous set of Teff and log g (see Sect. 3). We selected as bona fide LRGB stars those confined in a region of the Teff-log g diagram populated by RGB models evolving between the end of the FDU and the RGB bump (see MSB12) that satisfy the following criterion: −0.00216 · Teff + 14.76 < log g < −0.00366 · Teff + 19.88. The boundaries of this region are shown in Fig. 1. In addition, we checked that these stars have not yet experienced the extra mixing episode that occurs at the RGB bump by measuring their surface C and N abundances and, when possible, the C isotopic ratio 12C/13C (the latter can be measured in LRGB stars with [Fe/H] > −3.0 dex and in metal-poorer LRGB stars with high C abundances). C abundances (available for all the stars) and N abundances (available for two-thirds of the targets), combined with 12C/13C higher than 10–15 (for half of the sample), confirm that the carbon-normal stars discussed here are LRGB stars.
The final sample includes 58 LRGB stars with [Fe/H] < −1.3 dex, 33 of them with [Fe/H] < −2.8 dex, corresponding to metallicities in the Li meltdown region of dwarf stars (see Table 1); 50 target stars have been observed with the spectrograph UVES at the Very Large Telescope of ESO (Dekker et al. 2000), four stars with ELODIE mounted on the 1.93 m telescope of the Observatoire de Haute Provence (Moultaka et al. 2004), three stars with MIKE at the Magellan telescope (Bernstein et al. 2003), and one star with HARPS at the ESO La Silla 3.6m telescope (Mayor et al. 2003).
Almost all the spectra have resolutions higher than 40000 (in particular, two-thirds of the spectra used to measure the Li line have spectral resolutions between 40 000 and 50 000) and signal-to-noise ratios per pixel higher than 100 around the Li line at 6708 Å. Information about all the used spectra (instrument, spectral range and resolution, and ID program) is listed in Table 2. Compared to MSB12, we have enlarged the sample of LRGB stars by about a factor of three, and in particular we now have 19 stars with [Fe/H] ≤ −3 dex, compared to only one star in MSB12.
Atmospheric parameters and iron, lithium, and carbon abundances for the target stars.
Instrument, spectral range and resolution, ID program, and PI for each spectrum used in this work.
3 Chemical analysis
Stellar parameters were obtained from the photometry of the early third data release of the ESA/Gaia mission (Prusti et al. 2016; Gaia Collaboration 2021) in order to avoid the bias that affects spectroscopic parameters at low metallicities (Mucciarelli & Bonifacio 2020). The Teff values were derived adopting the (BP − RP)0-Teff transformation from Mucciarelli et al. (2021). Colour excesses were estimated from integration within 3D extinction maps (Ivanova et al. 2021) except for the star HE0401-0138, for which we adopted the value from Schlafly & Finkbeiner (2011). For very distant halo stars that fall outside the maps, we used the upper limits based on dust emission from Planck Collaboration Int. XXIX. (2016), which in all cases are very close to the value achieved at the map boundary. The extinction coefficients were derived by adopting the iterative procedure described in Lombardo et al. (2021). Surface gravities were obtained by adopting the photometric Teff, a stellar mass equal to 0.8 M0, the parallaxes from Gaia, and bolometric corrections calculated from a grid of synthetic spectra computed with the code SYNTHE (Kurucz 2005). Microturbulent velocities were estimated spectroscopically by minimising any trend between the abundances from Fe I lines and their reduced equivalent widths.
For all the targets, we measured Fe and Li abundances (see Table 2). The Fe abundances were derived with the code GALA (Mucciarelli et al. 2013) from the measured equivalent widths (the latter measured with DAOSPEC; Stetson & Pancino 2008). The Li abundances were derived from spectral synthesis, by fitting the observed profile of the Li resonance line at 6708 Å with suitable synthetic spectra. Three-dimensional non-local thermodynamic equilibrium (NLTE) corrections from Wang et al. (2021) were applied. For 11 stars, upper limits for A(Li) were estimated by comparing the observed spectra with suitable grids of synthetic spectra computed with different values of A(Li). The minimum A(Li) that allows the Li line to be identified with respect to the observed noise was evaluated through visual inspection. The similar levels of the derived upper limits only reflects the similar spectral quality of the spectra and parameters of the stars.
Additionally, for all targets we measured the C abundance from the G band or from the CH feature at 3143 Å to establish which objects are carbon-enhanced metal-poor (CEMP) stars. According to the selection criteria in Bonifacio et al. (2018), we considered as CEMP stars those stars with [C/Fe] > 1.0 dex for [Fe/H] > −4.0 dex and A(C) > 5.5 dex for [Fe/H] < −4.0 dex. Among the CEMP stars, we distinguished between low-C band and high-C band stars according to the two groups of stars usually identified in the A(C)–[Fe/H] diagram (Spite et al. 2013).
The total uncertainty on the measured abundances was estimated by summing in quadrature the error in the measurement procedure and that arising from the stellar parameters, including the covariance terms. The uncertainty arising from the fitting procedure (related to the quality of the spectra) was estimated by means of Monte Carlo simulations, by creating for each star a sample of 500 synthetic spectra with the appropriate instrumental resolution and pixel step and adding Poissonian noise to reproduce the observed S/N. The line-fitting procedure was repeated for these samples of simulated spectra, adopting as 1σ uncertainty the dispersion of the derived A(Li) distribution.
Radial velocities (RVs) were measured from the position of several metallic lines with DAOSPEC, with typical uncertainties lower than 0.1 km s−1. We compared the new measured RVs (see Table 2) with those from previous studies (Cohen et al. 2013; Norris et al. 2013; Roederer et al. 2014; Arentsen et al. 2019) and from Gaia Data Release 2 (Gaia Collaboration 2018). For four targets, only one RV measurement is available, and we cannot discuss their possible binary nature. In addition to six targets for which RV variations have already been discussed in the literature, we identified another five stars displaying RV variations that we consider to belong to binary systems (see Table 1).
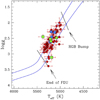 |
Fig. 1 Position of the observed LRGB targets (red circles) in the Teff-logg diagram. Blue and green squares are low- and high-C band CEMP stars, respectively. Two BaSTI theoretical isochrones (Pietrinferni et al. 2021) with an age of 12.5 Gyr, [Fe/H] =−3.2 and −1.5 dex, and an α-enhanced chemical mixture are shown as reference (blue curves). The predicted positions of the FDU completion and the RGB bump are marked as thick grey lines. |
4 Results
The behaviour of A(Li) as a function of [Fe/H] and Teff is shown in Fig. 2. The distribution of A(Li) of the LRGB stars exhibits a clear dichotomy, with two well-separated groups of stars.
The first are thin Li plateau stars. For 47 stars, the Li line is measurable, and the A(Li) values of these stars are very similar to one another, with an average A(Li) = 1.06 ± 0.01 dex (σ = 0.08 dex). The star SMSS_J031300.36-670839.3, the most metal-poor object of the sample ([Fe/H] < −7.0 dex), has A(Li) = 0.86 ± 0.05 dex, lower than the average value of the other stars. However, it’s extremely low iron content is outside the range of validity of the adopted colour-Teff relation. If the star SMSS_J031300.36-670839.3 is excluded, the average A(Li) of the sample is 1.07 ± 0.01 dex (σ = 0.07 dex). In both cases, the 1σ dispersion is compatible with an intrinsic null scatter, within the uncertainties of A(Li) measurements, of the order of 0.08–0.09 dex, dominated by the uncertainty on Teff (of the order of 80–100 K).
We checked the statistical significance of the correlations between A(Li) and [Fe/H] and between A(Li) and Teff, calculating the Pearson linear correlation coefficient and the non-parametric Spearman and Kendall correlation coefficients. The derived p-values for A(Li) and [Fe/H] are 0.1, 0.35, and 0.32, above the standard 0.05 threshold. This shows that the correlation between these two quantities is not statistically significant. On the other hand, the derived p-values for A(Li) and Teff are about 10−5 for all the correlation coefficients. The measured slope between A(Li) and Teff is equal to 0.04 ± 0.01 dex/100 K. We note that adoption of the 1D NLTE corrections by Lind et al. (2009) erases this small slope, changing the average A(Li) by only 0.01 dex and not affecting our conclusions.
All the stars populating this Li plateau are carbon-normal stars except SMSS_J031300.36-670839.3 and HE1506-0113, which are classified as low-carbon band CEMP stars. Eight stars display RV variations (including the CEMP star HE1506-0113), and they are considered as likely binary stars.
The second group, the remaining 11 stars, comprises Li-poor stars. For these stars the Li line is not detected, and we can only provide upper limits for A(Li), pointing out that these stars have A(Li) lower than 0.7 dex. This group of stars, made up of seven CEMP stars and four carbon-normal stars, is highly heterogeneous. Among the CEMP stars, five are classified as high-C band and two as low-C band CEMP stars. We can evaluate possible RV variations for the ten Li-poor stars that have multiple RV measurements. Radial velocity variations are identified for three (high-C band CEMP) stars of this group.
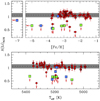 |
Fig. 2 Behaviour of A(Li) as a function of [Fe/H] and Teff (upper and lower panel, respectively). Symbols are the same as in Fig. 1. Arrows denote abundance upper limits. The dotted horizontal line denotes the average value of the measured A(Li), and the grey shaded area indicates the ±1σ region. |
5 Discussion
The distribution of A(Li) as a function of [Fe/H] for field halo LRGB stars is clearly different from that of dwarfs, showing a clear dichotomy and no evidence of a meltdown.
Figure 3 compares the measured values of A(Li) as a function of [Fe/H] for the LRGB stars on the Li plateau with predictions from standard theoretical models (see MSB12 for details), assuming that all these stars formed with the SBBN abundance A(Li) = 2.74 dex (Coc & Vangioni 2017) regardless of their metallicity. We first considered models that include only convection as a mechanism of element transport (corresponding to a fully inhibited atomic diffusion) and models with fully efficient atomic diffusion.
Both these sets of calculations are unable to reproduce the observed plateau as they predict A(Li) values higher than the observed ones by 0.3–0.4 dex and a mild decrease in A(Li) with increasing [Fe/H], because the FDU reaches deeper (in mass) layers when the metallicity increases. An agreement with observations can be obtained only by assuming an initial A(Li) significantly lower (by 0.3–0.4 dex) than the SBBN value. Also, the initial A(Li) should slowly increase with increasing [Fe/H], in stark contrast with current chemical evolution models that naturally predict a constant A(Li) for stars in this metallicity range (Matteucci et al. 2021).
To satisfy the constraint of a constant initial A(Li) equal to the SBBN value, some extra Li needs to be transported into the burning regions during the MS to match the abundances measured in LRGB stars. The amount of this additional Li to be burned has to depend on the initial metallicity of the stars, to counterbalance the variation in the post-FDU A(Li) with the [Fe/H] predicted by the models.
A parametrisation of this additional transport process has been proposed by Richard et al. (2002, 2005) to explain the A(Li) measured in Spite plateau dwarfs in terms of the SBBN Li abundance. We consider here the stellar models calculated by Deal et al. (2021), including Richard et al. (2002, 2005) parametrisation and extended to the RGB phase. In addition to convection and atomic diffusion, these models include a turbulent diffusion properly tuned to reproduce the Spite plateau. These models (see Fig. 3) predict a constant A(Li) for [Fe/H] > −4.0 dex, in agreement with our measurements, but with A(Li) about 0.15 dex higher than the measured values. This relatively minor discrepancy can be accounted for by considering small uncertainties in the theoretical predictions of A(Li) from SBBN calculations (see e.g. Coc et al. 2014) and systematics in the adopted Teff scale of LRGB stars.
Some analyses of the Big Bang nucleosynthesis theory have shown that the primordial lithium abundance could be smaller (by ~0.1 dex) by considering the expected variation (a few parts per million) of fundamental constants (see e.g. Evans et al. 2014; Clara & Martins 2020; Martins 2021; Deal & Martins 2021). Such a decrease in the primordial lithium abundance would improve the agreement between predicted and measured A(Li).
It is remarkable that the calibration of this turbulent diffusion – without any assumption on the physical causes of this mixing – to theoretically reproduce the Spite plateau starting for the SBBN Li abundance can also qualitatively reproduce the LRGB A(Li) despite a small offset. The amount of extra Li burned on the MS by these models is consistent with what we observe on the LRGB stars despite the fact that the calibration of this turbulent diffusion is completely independent of LRGB observations.
Another important result of the comparison in Fig. 3 is the following. Our LRGB sample defines a thin plateau over the entire range of [Fe/H] covered by the data, in particular at [Fe/H] < −2.8 dex, where a drop in the average A(Li) and a large abundance dispersion is observed among the dwarf stars (see Fig. 2 in Aguado et al. 2019). If these metal-poor dwarf stars really formed with a lower A(Li), we should expect the same proportion of Li-poor stars among the LRGB stars. Only three out of 25 LRGB stars with [Fe/H] <−2.8 dex are Li-poor, whilst in the same metallicity range two-thirds of the dwarf stars with measured Li abundances have A(Li) below the Spite plateau. The lack of a significant dispersion of A(Li) on the LRGB down to an initial [Fe/H] ~ −3.8 dex seems to rule out a spread of initial Li abundances to explain the Li meltdown observed in dwarfs.
Given that the same parametrisation of turbulent diffusion matching the Spite plateau abundances in dwarfs can also explain the observed LRGB abundances down to an initial [Fe/H] ~ −3.8 dex, the A(Li) values below the Spite plateau observed in meltdown dwarf stars are likely due to yet another surface chemical transport process that is efficient during the MS. This process only needs to be efficient, likely with star-to-star variations, below a threshold initial metallicity. Also, it must somehow deplete the surface A(Li) without bringing extra Li to the burning region; otherwise, we would observe its signature in LRGB stars.
In addition to this mechanism, part of the A(Li) dispersion observed in the meltdown stars could arise from stars that have experienced thermohaline convection induced by binary mass transfer (Deal et al. 2021), or they can be the ‘blue-stragglers-to-be’ proposed by Ryan et al. (2001), that is, the result of the coalescence of two low-mass stars. The blue straggler nature of three out of four of the Li-depleted stars studied by Ryan et al. (2001) has been confirmed via their Gaia parallaxes (Bonifacio et al. 2019). The Li-poor LRGB stars that we observe are the progeny of the Li-poor stars that populate the meltdown.
Among the 11 Li-poor stars observed in our sample, five are high-C band CEMP stars, and the lack of surface lithium can be easily explained as the result of mass transfer processes, most of these CEMP stars being in binary systems (Hansen et al. 2016; Bonifacio et al. 2018; Arentsen et al. 2019). The other six Li-poor stars (two low-C band CEMP and four carbon-normal stars) do not show evidence of RV variations, and their low A(Li) cannot be explained by invoking mass transfer processes. These stars are good blue straggler star candidates (i.e. the product of a coalescence process). However, we cannot exclude other mechanisms able to form Li-poor stars.
When stars evolve along the RGB, the MS surface Li depletion due to the additional mixing process is erased by the deepening convection, which restores the uniform A(Li) as a function of [Fe/H] observed among the LRGB stars. On the other hand, the objects populating the meltdown that formed with A(Li) lower than the SBBN value will show up as LRGB stars with a surface lithium abundance lower than the LRGB plateau. This scenario qualitatively explains the existence of the meltdown among the dwarfs and the A(Li) dichotomy among the giants.
To conclude, the discovery of a thin Li abundance plateau (coupled with a distinct Li-poor sub-population) in LRGB stars provides new insights into the evolution of A(Li) in metal-poor stars and helps constrain chemical element transport mechanisms. The evidence coming from dwarf and metal-poor LRGB stars suggests that they all formed with the same initial Li abundance, consistent with the SBBN value; however, they have experienced thermohaline convection induced by binary mass transfer or were formed from coalescence. The turbulent diffusion proposed by Richard et al. (2002, 2005) seems to work well to explain dwarf and giant stars, reconciling the two sets of A(Li) measurements with the SBBN value. As a note of caution, we stress that this is only a phenomenological solution to the cosmological lithium problem as we still lack a physical description of this process. Nevertheless, transport processes such as rotation-induced mixing and penetrative convection are promising candidates (Deal & Martins 2021).
Our analysis also shows that any future observational and theoretical investigation aimed at comprehensively studying the lithium abundances in metal-poor stars must be able to simultaneously explain the Spite plateau and meltdown among dwarf stars and the thin plateau among LRGB stars.
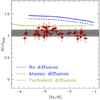 |
Fig. 3 Behaviour of A(Li) as a function of [Fe/H] for the stars on the RGB Li plateau, compared to predictions from models calculated with and without atomic diffusion (dashed and solid blue curves, respectively) according to MSB12, and with atomic diffusion plus an additional turbulent diffusion (green curve) as described in Deal et al. (2021). All models are calculated with an initial SBBN A(Li) = 2.74 dex. |
Acknowledgements
The authors thank the anonymous referee for the useful suggestions and E. Wang for her helpful comments about NLTE corrections. A.M. is grateful to the Scientific Council of Observatoire de Paris that funded his extended visit at GEPI, where part of this work was carried out. L.M. acknowledges support from proyecto interno of the Universidad Andres Bello. M.S. acknowledges support from the STFC Consolidated Grant ST/V00087X/1. This work was supported by FCT/MCTES through the research grants UIDB/04434/2020, UIDP/04434/2020 and PTDC/FIS-AST/30389/2017, and by FEDER – Fundo Europeu de Desenvolvimento Regional through COM-PETE2020 – Programa Operacional Competitividade e Internacionalização (grant: POCI-01-0145-FEDER-030389). M.D. is supported by national funds through FCT in the form of a work contract. OAR and MD acknowledge financial support from the “Programme National de Physique Stellaire” (PNPS) of the CNRS/INSU co-funded by the CEA and the CNES, France.
References
- Aguado, D.S., Gonzalez Hernandez, J.I., Allende Prieto, C., et al. 2019, ApJ, 874, L21 [NASA ADS] [CrossRef] [Google Scholar]
- Aoki, W., Barklem, P.S., Beers, T.C., et al. 2009, ApJ, 698, 1803 [NASA ADS] [CrossRef] [Google Scholar]
- Arentsen, A., Starkenburg, E., Shetrone, M.D., et al. 2019, A&A, 621, A108 [NASA ADS] [CrossRef] [EDP Sciences] [Google Scholar]
- Asplund, M., Lambert, D.L., Nissen, P.E., et al. 2006, ApJ, 644, 229 [NASA ADS] [CrossRef] [Google Scholar]
- Bernstein, R., Shectman, S.A., Gunnels, S.M., et al. 2003, Proc. SPIE, 4841, 1694 [NASA ADS] [CrossRef] [Google Scholar]
- Bonifacio, P., Molaro, P., Sivarani, T., et al. 2007, A&A, 462, 851 [NASA ADS] [CrossRef] [EDP Sciences] [Google Scholar]
- Bonifacio, P., Caffau, E., Spite, M., et al. 2018, A&A, 612, A65 [NASA ADS] [CrossRef] [EDP Sciences] [Google Scholar]
- Bonifacio, P., Caffau, E., Spite, M., et al. 2019, Res. Notes Am. Astron. Soc., 3, 64 [Google Scholar]
- Clara, M.T., & Martins, C.J.A.P. 2020, A&A, 633, L11 [NASA ADS] [CrossRef] [EDP Sciences] [Google Scholar]
- Coc, A., & Vangioni, E. 2017, Int. J. Mod. Phys. E, 26, 1741002 [CrossRef] [Google Scholar]
- Coc, A., Uzan, J.-P., & Vangioni, E. 2014, J. Cosmology Astropart. Phys., 2014, 050 [CrossRef] [Google Scholar]
- Cohen, J.G., Christlieb, N., Thompson, I., et al. 2013, ApJ, 778, 56 [NASA ADS] [CrossRef] [Google Scholar]
- Deal, M., & Martins, C.J.A.P. 2021, A&A, 653, A48 [NASA ADS] [CrossRef] [EDP Sciences] [Google Scholar]
- Deal, M., Richard, O., & Vauclair, S. 2021, A&A, 646, A160 [NASA ADS] [CrossRef] [EDP Sciences] [Google Scholar]
- Dekker, H., D'Odorico, S., Kaufer, A., Delabre, B., & Kotzlowski, H., 2000, SPIE, 4008, 534 [NASA ADS] [Google Scholar]
- Dumont, T., Palacios, A., Charbonnel, C., et al. 2021, A&A, 646, A48 [EDP Sciences] [Google Scholar]
- Evans, T.M., Murphy, M.T., Whitmore, J.B., et al. 2014, MNRAS, 445, 128 [NASA ADS] [CrossRef] [Google Scholar]
- Gaia Collaboration 2018, VizieR Online Data Catalog: I/345 [Google Scholar]
- Gaia Collaboration (Prusti, T., et al.) 2016, A&A, 595, A1 [NASA ADS] [CrossRef] [EDP Sciences] [Google Scholar]
- Gaia Collaboration (Brown, A.G.A., et al.) 2021, A&A, 649, A1 [NASA ADS] [CrossRef] [EDP Sciences] [Google Scholar]
- Gavel, A., Gruyters, P., Heiter, U., et al. 2021, A&A, 652, A75 [NASA ADS] [CrossRef] [EDP Sciences] [Google Scholar]
- Gratton, R., Sneden, C., & Carretta, E. 2004, ARA&A, 42, 385 [Google Scholar]
- Hansen, T.T., Andersen, J., Nordström, B., et al. 2016, A&A, 586, A160 [NASA ADS] [CrossRef] [EDP Sciences] [Google Scholar]
- Ivanova, A., Lallement, R., Vergely, J.L., et al. 2021, A&A, 652, A22 [NASA ADS] [CrossRef] [EDP Sciences] [Google Scholar]
- Korn, A.J. 2020, Mem. Soc. Astron. It., 91, 105 [NASA ADS] [Google Scholar]
- Korn, A.J., Grundahl, F., Richard, O., et al. 2006, Nature, 442, 657 [NASA ADS] [CrossRef] [Google Scholar]
- Kurucz, R.L., 2005, MSAIS, 8, 14 [Google Scholar]
- Lind, K., Asplund, M., & Barklem, P.S. 2009, A&A, 503, 541 [NASA ADS] [CrossRef] [EDP Sciences] [Google Scholar]
- Lombardo, L., François, P., Bonifacio, P., et al. 2021, A&A, 656, A155 [NASA ADS] [CrossRef] [EDP Sciences] [Google Scholar]
- Martins, C.J.A.P. 2021, A&A, 646, A47 [NASA ADS] [CrossRef] [EDP Sciences] [Google Scholar]
- Matteucci, F., Molero, M., Aguado, D.S., et al. 2021, MNRAS, 505, 200 [NASA ADS] [CrossRef] [Google Scholar]
- Mayor, M., Pepe, F., Queloz, D., et al. 2003, The Messenger, 114, 20 [NASA ADS] [Google Scholar]
- Michaud, G., Alecian, G., & Richer, J. 2015, Atomic Diffusion in Stars, Astronomy and Astrophysics Library (Switzerland: Springer International Publishing) [CrossRef] [Google Scholar]
- Moultaka, J., Ilovaisky, S.A., Prugniel, P., et al. 2004, PASP, 116, 693 [NASA ADS] [CrossRef] [Google Scholar]
- Mucciarelli, A., & Bonifacio, P. 2020, A&A, 640, A87 [NASA ADS] [CrossRef] [EDP Sciences] [Google Scholar]
- Mucciarelli, A., Salaris, M., Lovisi, L., et al. 2011, MNRAS, 412, 81 [NASA ADS] [CrossRef] [Google Scholar]
- Mucciarelli, A., Salaris, M., & Bonifacio, P. 2012, MNRAS, 419, 2195 [NASA ADS] [CrossRef] [Google Scholar]
- Mucciarelli, A., Pancino, E., Lovisi, L., et al. 2013, ApJ, 766, 78 [NASA ADS] [CrossRef] [Google Scholar]
- Mucciarelli, A., Salaris, M., Bonifacio, P., et al. 2014, MNRAS, 444, 1812 [NASA ADS] [CrossRef] [Google Scholar]
- Mucciarelli, A., Salaris, M., Monaco, L., et al. 2018, A&A, 618, A134 [NASA ADS] [CrossRef] [EDP Sciences] [Google Scholar]
- Mucciarelli, A., Bellazzini, M., & Massari, D. 2021, A&A, 653, A90 [NASA ADS] [CrossRef] [EDP Sciences] [Google Scholar]
- Norris, J.E., Bessell, M.S., Yong, D., et al. 2013, ApJ, 762, 25 [NASA ADS] [CrossRef] [Google Scholar]
- Pietrinferni, A., Hidalgo, S., Cassisi, S., et al. 2021, ApJ, 908, 102 [NASA ADS] [CrossRef] [Google Scholar]
- Planck Collaboration Int. XXIX. 2016, A&A, 586, A132 [NASA ADS] [CrossRef] [EDP Sciences] [Google Scholar]
- Richard, O., Michaud, G., & Richer, J. 2002, ApJ, 580, 1100 [Google Scholar]
- Richard, O., Michaud, G., & Richer, J. 2005, ApJ, 619, 538 [Google Scholar]
- Roederer, I.U., Preston, G.W., Thompson, I.B., et al. 2014, AJ, 147, 136 [NASA ADS] [CrossRef] [Google Scholar]
- Ryan, S.G., Beers, T.C., Kajino, T., et al. 2001, ApJ, 547, 231 [NASA ADS] [CrossRef] [Google Scholar]
- Salaris, M., & Cassisi, S. 2017, R. Soc. Open Science, 4, 170192 [NASA ADS] [CrossRef] [Google Scholar]
- Sbordone, L., Bonifacio, P., Caffau, E., et al. 2010, A&A, 522, A26 [NASA ADS] [CrossRef] [EDP Sciences] [Google Scholar]
- Schlafly, E.F., & Finkbeiner, D.P. 2011, ApJ, 737, 103 [NASA ADS] [CrossRef] [Google Scholar]
- Spite, M., & Spite, F. 1982, Nature, 297, 483 [NASA ADS] [CrossRef] [Google Scholar]
- Spite, M., Cayrel, R., Plez, B., et al. 2005, A&A, 430, 655 [NASA ADS] [CrossRef] [EDP Sciences] [Google Scholar]
- Spite, M., Spite, F., & Bonifacio, P. 2012, Mem. Soc. Astron. It. Suppl., 22, 9 [Google Scholar]
- Spite, M., Caffau, E., Bonifacio, P., et al. 2013, A&A, 552, A107 [NASA ADS] [CrossRef] [EDP Sciences] [Google Scholar]
- Stetson, P.B., & Pancino, E., 2008, PASP, 120, 1332 [NASA ADS] [CrossRef] [Google Scholar]
- Suda, T., Katsuta, Y., Yamada, S., et al. 2008, PASJ, 60, 1159 [NASA ADS] [Google Scholar]
- Vauclair, S., & Charbonnel, C. 1995, A&A, 295, 715 [NASA ADS] [Google Scholar]
- Vick, M., Michaud, G., Richer, J., et al. 2013, A&A, 552, A131 [NASA ADS] [CrossRef] [EDP Sciences] [Google Scholar]
- Yong, D., Norris, J.E., Bessell, M.S., et al. 2013, ApJ, 762, 26 [NASA ADS] [CrossRef] [Google Scholar]
- Wang, E.X., Nordlander, T., Asplund, M., et al. 2021, MNRAS, 500, 2159 [Google Scholar]
 , where Na is the number fraction of element a.
Its simple formulation could be easily implemented in any stellar evolutionary code.
All Tables
Atmospheric parameters and iron, lithium, and carbon abundances for the target stars.
Instrument, spectral range and resolution, ID program, and PI for each spectrum used in this work.
All Figures
|
Fig. 1 Position of the observed LRGB targets (red circles) in the Teff-logg diagram. Blue and green squares are low- and high-C band CEMP stars, respectively. Two BaSTI theoretical isochrones (Pietrinferni et al. 2021) with an age of 12.5 Gyr, [Fe/H] =−3.2 and −1.5 dex, and an α-enhanced chemical mixture are shown as reference (blue curves). The predicted positions of the FDU completion and the RGB bump are marked as thick grey lines. |
| In the text | |
|
Fig. 2 Behaviour of A(Li) as a function of [Fe/H] and Teff (upper and lower panel, respectively). Symbols are the same as in Fig. 1. Arrows denote abundance upper limits. The dotted horizontal line denotes the average value of the measured A(Li), and the grey shaded area indicates the ±1σ region. |
| In the text | |
|
Fig. 3 Behaviour of A(Li) as a function of [Fe/H] for the stars on the RGB Li plateau, compared to predictions from models calculated with and without atomic diffusion (dashed and solid blue curves, respectively) according to MSB12, and with atomic diffusion plus an additional turbulent diffusion (green curve) as described in Deal et al. (2021). All models are calculated with an initial SBBN A(Li) = 2.74 dex. |
| In the text | |
Current usage metrics show cumulative count of Article Views (full-text article views including HTML views, PDF and ePub downloads, according to the available data) and Abstracts Views on Vision4Press platform.
Data correspond to usage on the plateform after 2015. The current usage metrics is available 48-96 hours after online publication and is updated daily on week days.
Initial download of the metrics may take a while.