Free Access
Fig. 2
Download original image
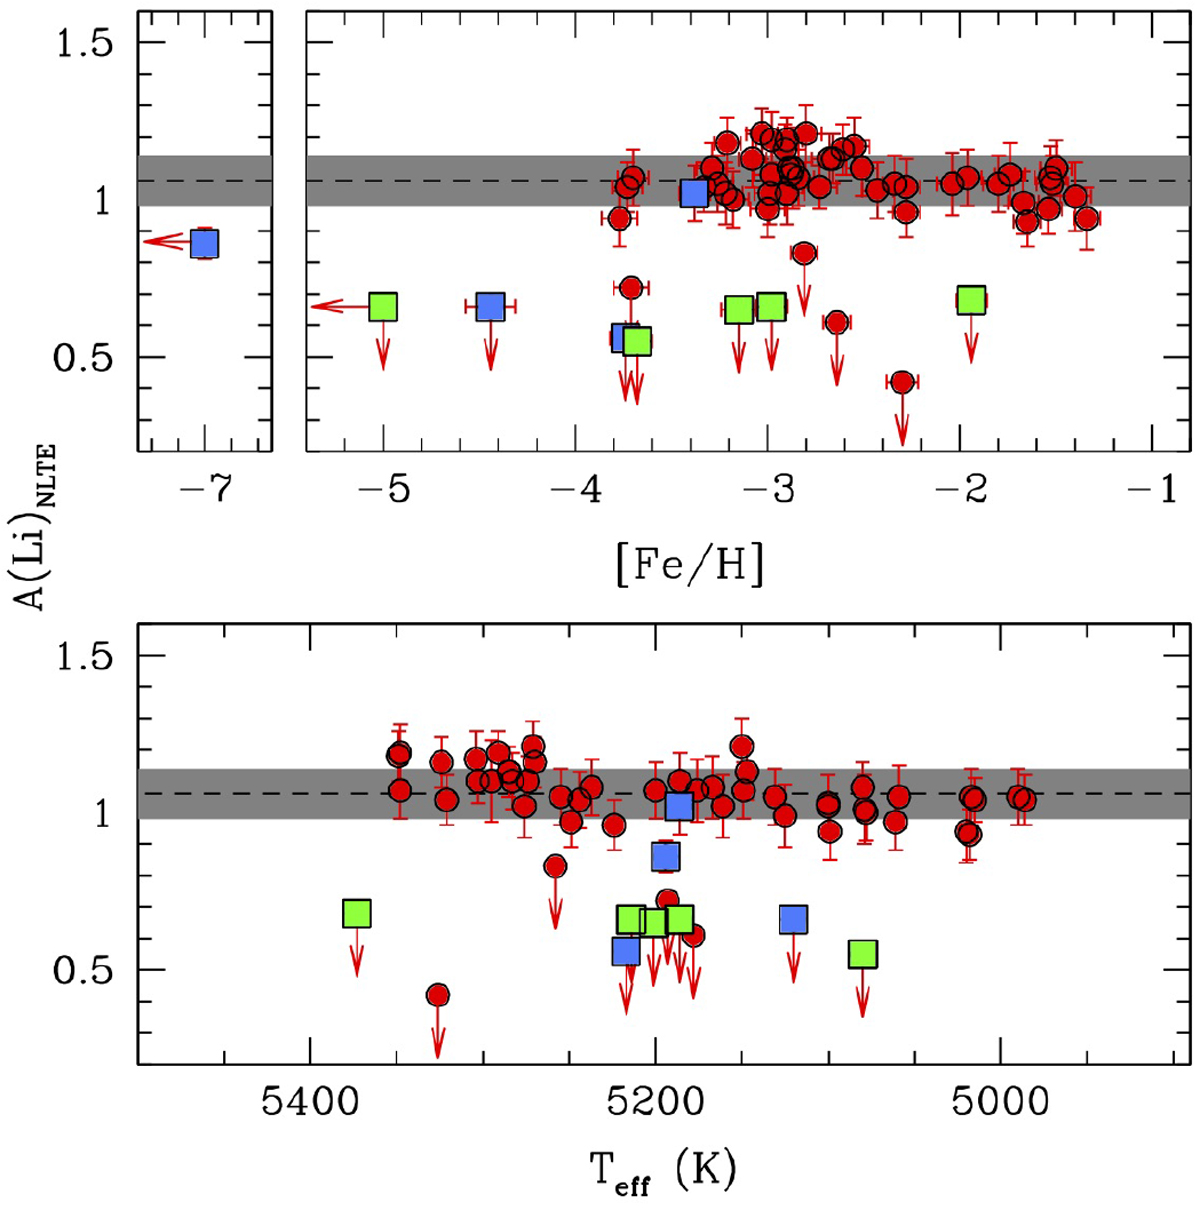
Behaviour of A(Li) as a function of [Fe/H] and Teff (upper and lower panel, respectively). Symbols are the same as in Fig. 1. Arrows denote abundance upper limits. The dotted horizontal line denotes the average value of the measured A(Li), and the grey shaded area indicates the ±1σ region.
Current usage metrics show cumulative count of Article Views (full-text article views including HTML views, PDF and ePub downloads, according to the available data) and Abstracts Views on Vision4Press platform.
Data correspond to usage on the plateform after 2015. The current usage metrics is available 48-96 hours after online publication and is updated daily on week days.
Initial download of the metrics may take a while.