| Issue |
A&A
Volume 661, May 2022
|
|
|---|---|---|
| Article Number | A87 | |
| Number of page(s) | 15 | |
| Section | Stellar structure and evolution | |
| DOI | https://doi.org/10.1051/0004-6361/202142636 | |
| Published online | 05 May 2022 | |
Searching for pulsars associated with polarised point sources using LOFAR: Initial discoveries from the TULIPP project
1
CSIRO Space and Astronomy, PO Box 1130, Bentley, WA 6102, Australia
e-mail: This email address is being protected from spambots. You need JavaScript enabled to view it.
2
ASTRON, Netherlands Institute for Radio Astronomy, Oude Hoogeveensedijk 4, 7991 PD Dwingeloo, The Netherlands
e-mail: This email address is being protected from spambots. You need JavaScript enabled to view it.
3
School of Physical Sciences and Centre for Astrophysics & Relativity, Dublin City University, D09 W6Y4 Glasnevin, Ireland
4
Leiden Observatory, Leiden University, PO Box 9513, 2300 RA Leiden, The Netherlands
5
Department of Physics, McGill University, 3600 rue University, Montréal, QC H3A 2T8, Canada
6
McGill Space Institute, McGill University, 3550 rue University, Montréal, QC H3A 2A7, Canada
7
Anton Pannekoek Institute for Astronomy, University of Amsterdam, Science Park 904, 1098 XH Amsterdam, The Netherlands
8
Astro Space Centre, Lebedev Physical Institute, Russian Academy of Sciences, Profsoyuznaya Str. 84/32, Moscow 117997, Russia
9
Jodrell Bank Centre for Astrophysics, School of Physics and Astronomy, University of Manchester, Manchester M13 9PL, UK
10
Kapteyn Astronomical Institute, University of Groningen, Postbus 800, 9700 AV Groningen, The Netherlands
11
INAF Istituto di Radioastronomia, Via Gobetti 101, 40129 Bologna, Italy
12
LPC2E – Université d’Orléans / CNRS, France
13
Station de Radioastronomie de Nançay, Observatoire de Paris, CNRS/INSU, USR 704 – Univ. Orléans, OSUC, 18330 Nançay, France
14
Department of Astrophysics/IMAPP, Radboud University, PO Box 9010, Nijmegen 6500 GL, The Netherlands
15
Oxford Astrophysics, Denys Wilkinson Building, Keble Road, Oxford OX1 3RH, UK
Received:
9
November
2021
Accepted:
9
February
2022
Abstract
Discovering radio pulsars, particularly millisecond pulsars (MSPs), is important for a range of astrophysical applications, such as testing theories of gravity or probing the magneto-ionic interstellar medium. We aim to discover pulsars that may have been missed in previous pulsar searches by leveraging known pulsar observables (primarily polarisation) in the sensitive, low-frequency radio images from the Low-Frequency Array (LOFAR) Two-metre Sky Survey (LoTSS), and have commenced the Targeted search, using LoTSS images, for polarised pulsars (TULIPP) survey. For this survey, we identified linearly and circularly polarised point sources with flux densities brighter than 2 mJy in LoTSS images at a centre frequency of 144 MHz with a 48 MHz bandwidth. Over 40 known pulsars, half of which are MSPs, were detected as polarised sources in the LoTSS images and excluded from the survey. We have obtained beam-formed LOFAR observations of 30 candidates, which were searched for pulsations using coherent de-dispersion. Here, we present the results of the first year of the TULIPP survey. We discovered two pulsars, PSRs J1049+5822 and J1602+3901, with rotational periods of P = 0.73 s and 3.7 ms, respectively. We also detected a further five known pulsars (two slowly-rotating pulsars and three MSPs) for which accurate sky positions were not available to allow a unique cross-match with LoTSS sources. This targeted survey presents a relatively efficient method by which pulsars, particularly MSPs, may be discovered using the flexible observing modes of sensitive radio telescopes such as the Square Kilometre Array and its pathfinders/precursors, particularly since wide-area all-sky surveys using coherent de-dispersion are currently computationally infeasible.
Key words: pulsars: general / polarization / radio continuum: stars / methods: data analysis / surveys / Galaxy: stellar content
© ESO 2022
1. Introduction
Discovering pulsars is vital for improving our understanding of the Galactic population of neutron stars (e.g., Lorimer et al. 2006; Kaspi et al. 2018; Rajwade et al. 2018). In particular, the discovery of millisecond pulsars (MSPs; with rotational spin periods of P ≲ 10 ms, also referred to as ‘recycled’ pulsars; e.g., Tauris 2012) is a high priority for pulsar surveys because they provide particularly unique and powerful probes of fundamental physics (e.g., Demorest et al. 2010; Antoniadis et al. 2013; Ransom et al. 2014; Archibald et al. 2018), including towards detecting nanohertz gravitational wave signals via Pulsar Timing Arrays (e.g., Perera et al. 2019). In addition, a dense network of pulsars provides three-dimensional lines of sight, which allows us to investigate our Galaxy’s intervening magneto-ionic interstellar medium (ISM; e.g., Yao et al. 2017; Deller et al. 2019; Sobey et al. 2019).
To date, the majority of the pulsar population, and most slowly rotating (non-recycled) radio pulsars, have been discovered using wide-area, untargeted surveys, where large areas of the sky are observed at high time resolution to search for periodic, dispersed signals. These surveys have used either large single dish antennas (e.g., Manchester et al. 2001; Cordes et al. 2006; Keith et al. 2010; Deneva et al. 2013; Stovall et al. 2014; Keane et al. 2018; Cameron et al. 2020; Han et al. 2021), or interferometers (e.g., Bhattacharyya et al. 2016; Sanidas et al. 2018; Venkatraman Krishnan et al. 2020; Good et al. 2021; Swainston et al. 2021). Moreover, a large number of MSPs have been discovered through targeted surveys towards globular clusters1 (e.g., Ransom et al. 2005; Hessels et al. 2006, 2007; Ransom 2008; Dai et al. 2020; Pan et al. 2021; Ridolfi et al. 2021) and/or high-energy sources (e.g., Wijnands & van der Klis 1998; Abdo et al. 2010; Camilo et al. 2015; Bassa et al. 2017b; Clark & Fermi-LAT Collaboration 2017; Frail et al. 2018). Several pulsars, including the first MSP known, have been discovered through identification as pulsar candidates using radio interferometric images, selected based on criteria including a high degree of polarisation, steep spectrum, and/or variability (e.g., Backer et al. 1982; Hamilton et al. 1985; Lyne et al. 1987; Strom 1987; Kulkarni et al. 1988; Navarro et al. 1995; Jelić et al. 2015; Kaplan et al. 2019).
The impulsive radio signals from pulsars are delayed in time as they propagate through the ionised ISM, proportionally to the observing wavelength squared, an effect known as dispersion. To accurately detect the pulse profiles of pulsars, this effect must be corrected in radio observation data through dispersion removal, or de-dispersion (e.g., Lorimer & Kramer 2004). The data from all-sky pulsar surveys require de-dispersion at many trial dispersion measures (DMs) up to thousands of pc cm−3 (e.g., Lyon et al. 2016). Typically, incoherent de-dispersion has been used, which is a computationally expensive process, although recent implementations for graphics processing units (GPUs) have enabled real-time processing (e.g., Magro et al. 2011; Barsdell et al. 2012; Sclocco et al. 2020).
Coherent de-dispersion can almost completely mitigate the effects of dispersive smearing of the pulse profile up to high dispersion measures (e.g., Hankins & Rickett 1975) and is particularly important for low-frequency observations, due to the dependence on wavelength. However, coherent de-dispersion requires larger data volumes, increasing the computational requirements, rendering its use in wide-area pulsar surveys computationally infeasible at present (e.g., Bassa et al. 2017a). However, its use in targeted searches of pulsar candidate sources is feasible. For example, a targeted survey using Low-Frequency Array (LOFAR; Stappers et al. 2011; van Haarlem et al. 2013) observations of unidentified γ-ray sources from the Fermiγ-ray Space Telescope (Atwood et al. 2009) pioneered the use of GPU-accelerated coherent dispersion removal for pulsar searches at low frequencies (Bassa et al. 2017a). This resulted in the discovery of three fast-spinning (P < 5 ms) MSPs (e.g., Pleunis et al. 2017), including the fastest-spinning MSP known in the Galactic field (i.e., outside a globular cluster; P = 1.41 ms; Bassa et al. 2017b). Two of these pulsars also show particularly steep radio spectral indices2 (α < −2.5), and they likely could have only been discovered at low radio frequencies (ν < 300 MHz).
The emission from pulsars is often highly polarised (average linear polarisation fractions of ∼20% that usually increase towards lower frequencies, and average circular polarisation fractions of ∼10% that usually decrease towards lower frequencies), which provides valuable information about the intrinsic radio emission and its propagation through the ISM (e.g., Radhakrishnan & Cooke 1969; Gould & Lyne 1998; Johnston et al. 2008; Noutsos et al. 2015; Xue et al. 2019; Sobey et al. 2021). In addition, the radio spectral indices of pulsar emission are generally described well by a steep power law (e.g., Bates et al. 2013; Bilous et al. 2016; Jankowski et al. 2018). For example, 15 of 48 MSPs detected using LOFAR have spectral indices of α < −2 (Kondratiev et al. 2016). For comparison, the average spectral indices for typical radio sources in large surveys is ∼0.7 − 0.8 (e.g., de Gasperin et al. 2018). Indeed, understanding the population of steep-spectrum, polarised, short-period pulsars is especially critical for determining the prospects and strategies for imaging, wide-area and targeted pulsar surveys using the Square Kilometre Array (SKA), which has the potential to discover thousands of pulsars and MSPs (e.g., Hessels et al. 2015; Keane et al. 2015; Xue et al. 2017; Levin et al. 2018).
The LOFAR Two-metre Sky Survey (LoTSS3) is a deep 120–168 MHz imaging survey that facilitates a range of science goals and will eventually cover the entire northern sky (Shimwell et al. 2017). The first LoTSS public data release (DR1) covers 424 deg2 in the region of the HETDEX Spring Field with up to 6″ resolution and 71 μJy beam−1 median sensitivity (Shimwell et al. 2019). The second LoTSS data release (DR2) covers a larger sky area of 5635 deg2 and includes full polarisation data products (Stokes I, Q, U, V) (Tasse et al. 2021; Shimwell et al. 2022). The LOFAR Magnetism Key Science project4 used the LoTSS-DR2 data products to produce an ‘RM GRID’: a catalogue of ∼2500 linearly polarised sources and their Faraday rotation measures (RMs; O’Sullivan et al., in prep.). This facilitates a range of science goals aimed at investigating magnetic fields (e.g., Heald et al. 2020; O’Sullivan et al. 2020; Herrera Ruiz et al. 2021; Hutschenreuter et al. 2022). Despite the high Galactic latitudes of the observations (b ∼ −33° and 70°), this catalogue contains over 30 known pulsars, over 50% of which are MSPs (O’Sullivan et al., in prep.). Furthermore, the circularly polarised component of LoTSS-DR2 (V-LoTSS; Callingham et al., in prep.) represents the most sensitive, wide-field Stokes V survey conducted to date. There are tens of known pulsars and many highly circularly polarised sources with no optical counterparts. LoTSS is the first imaging survey with sufficient sensitivity to detect most nearby radio pulsars as point sources. The linear and circular polarisation catalogues from the LoTSS survey, therefore, present a novel, sensitive, and efficient method to identify sources that may be undiscovered pulsars (candidates). For confirmation, these sources can be followed-up at the same frequencies using LOFAR pulsar observations and searched for periodic signals.
Particularly relevant to this work is the LOFAR Tied-Array All-Sky Survey (LOTAAS5). This all-sky low-frequency (135 MHz) pulsar survey, using the addition of the signals from the six central ‘Superterp’ LOFAR High-Band Antenna (HBA) stations, has discovered 74 pulsars to date (Coenen et al. 2014; Tan et al. 2018a, 2020; Sanidas et al. 2019; Michilli et al. 2020). The time sampling (492 μs) and incoherent de-dispersion used in processing the LOTAAS data limits the sensitivity to MSPs with DM > 10 pc cm−3 (Sanidas et al. 2019). For comparison, 96% of the known MSP population have DMs > 10 pc cm−3, with a median of 57 pc cm−3 (ATNF Pulsar Catalogue; Manchester et al. 2005)6.
Targeted searches complement and enhance the capabilities of LOFAR pulsar surveys to discover pulsars. Not only can these make use of coherent de-dispersion, but greater observing sensitivities may also be achieved. Depending on the positional uncertainties of candidate sources, additional LOFAR HBA stations can be included in the tied-array observations, up to the innermost 24 core stations (longest baseline 3.6 km), providing ≈4× greater instantaneous sensitivity than six ‘superterp’ stations (longest baseline 0.3 km) alone. Targeted pulsar searches (including selecting promising candidates using LoTSS) are also beneficial because the source’s sky positions are known to a higher precision ( ; Shimwell et al. 2022) compared to those obtained from traditional, wide-area pulsar surveys, which aids achieving a pulsar timing solution more efficiently (e.g., sky position is covariant with rotational spin-down, Ṗ; e.g., Parthasarathy et al. 2019).
Here, we present the methodology and the results from the first year (two LOFAR observing cycles, LC12 and LC13, 2019 June 1 – 2020 May 31) of the ongoing targeted radio pulsar survey, TULIPP (Targeted search, Using LoTSS Images, for Polarised Pulsars). In Sect. 2 we describe the selection of promising pulsar candidates, identified as linearly and circularly polarised LoTSS unresolved/point sources. In Sect. 3, we provide an overview of the LOFAR pulsar observations using the high time resolution, tied-array, beam-forming modes and the data processing including the pulsar search pipelines. We present our results in Sect. 4, including the first two pulsars discovered in the TULIPP survey, PSRs J1049+5822 and J1602+3901. We discuss and conclude in Sects. 5 and 6.
The TULIPP survey is now a long-term LOFAR project, and the number of pulsar candidates has continued to grow after processing additional LoTSS DR2 fields. The candidates and results from LC14 onward will be presented in a follow-up paper (Bassa et al., in prep.).
2. Selection of pulsar candidates
The pulsar candidate selection matured in line with the progress of the LoTSS data processing for the linear and circular polarisation images. Prior to LC12 and LC13, ∼150 and ∼845 LoTSS fields had been processed through the linear polarisation ‘RM GRID’ pipeline and catalogued in circular polarisation, respectively. These produced a catalogue of over ∼2500 and ∼100 sources, respectively (O’Sullivan et al., in prep.; Callingham et al., in prep.). During LC12 and LC13, we observed nine linearly polarised pulsar candidates, and 21 circularly polarised pulsar candidates, summarised in Table 1. We describe how these sources were selected below.
LoTSS sources selected as pulsar candidates based on their polarisation properties.
We used the following initial criteria to identify pulsar candidates in linear polarisation images from the LoTSS RM GRID catalogue: (1) unresolved in LoTSS linear polarisation images at 20″ resolution (later confirmed using the Stokes I LoTSS images with 6″ resolution). Since pulsars are compact objects of only ∼tens of kilometres in size (e.g., Riley et al. 2021) at ∼kpc distances, they appear as point sources in images. (2) > 2 mJy total intensity (Stokes I) flux density. This limit provides LoTSS sources detected with sufficient sensitivity (∼30σ) to obtain reliable polarisation measurements, and they are suitably bright to be detected using LOFAR Core-station, tied-array, beam-formed observations of ∼20 − 80 mins. For comparison to higher frequency surveys, this limit corresponds to 20 μJy at 1.4 GHz for a source with a spectral index of −2. (3) > 7% linear polarisation fraction. This is both greater than the expected instrumental polarisation leakage in LoTSS images (Shimwell et al. 2022), and higher than many radio galaxies and blazars at 144 MHz, which have larger |RMs| and de-polarisation due to Faraday complexity (e.g., Anderson et al. 2015; Lenc et al. 2017, O’Sullivan et al., in prep.).
We used the following initial criteria to identify pulsar candidates in circular polarisation data from the V-LoTSS catalogue: (1) unresolved in the Stokes I LoTSS images with 6″ resolution. (2) > 5 mJy total intensity flux density. There were a larger number of candidate sources in circular polarisation than linear polarisation, so we used a higher flux density threshold than that for the linearly polarised sources to obtain a sufficient number of candidates to begin the TULIPP survey. (3) > 1% absolute (i.e., left or right handed) circular polarisation fraction. This is greater than the expected instrumental polarisation leakage (Callingham et al. 2021) and also higher than many radio galaxies and blazars (e.g., Macquart & Fender 2004).
These initial candidate lists were cross-checked with the ATNF Pulsar Catalogue, as well as pulsar discovery websites for ongoing surveys introduced in Sect. 1. Any source positions cross-matched with those of known pulsars were removed from the candidate list. This resulted in the removal of 25 linearly polarised sources in total for LC12 and LC13 (13 MSPs; 3 mildly recycled pulsars; 8 non-recycled pulsars). Nine of these pulsars have RMs published in the literature and show good agreement with the LoTSS RM GRID results (e.g., Manchester et al. 2005; Sobey et al. 2019, O’Sullivan et al., in prep.). This also resulted in the removal of 35 circularly polarised sources coincident with known pulsars (approximately half of which are MSPs).
The remaining pulsar candidates were cross-matched for multi-wavelength counterparts within a conservative search radius of 10″ from the LoTSS source positions in the optical (including SDSS; Alam et al. 2015, Gaia; Gaia Collaboration 2016, 2018, and Pan-STARRS; Chambers et al. 2016), infrared (including 2MASS; Cutri et al. 2003, SWIRE; Lonsdale et al. 2003, WISE; Wright et al. 2010), radio (including NVSS; Condon et al. 1998, FIRST; Helfand et al. 2015), and γ-ray (Fermi; Abdollahi et al. 2020). We refined the list of candidates such that they either have no associated multi-wavelength counterpart within 10″ in these surveys, or their multi-wavelength counterparts do not preclude the possibility that they are pulsars or pulsar systems, including optical/IR counterparts fainter than r = 16 and not classified as a galaxy. This reduced the list of candidates by more than half, while preventing selecting against pulsars with optically bright binary companions (e.g., Antoniadis 2021). NVSS and FIRST surveys were used to exclude sources because these are likely to be radio galaxies with flatter spectral indices. No known pulsars were excluded using the NVSS or FIRST surveys’ cross-match (e.g., Kaplan et al. 1998), as these had already been deselected using the ATNF pulsar catalogue.
The properties of the nine selected linearly polarised sources include Stokes I flux densities at 144 MHz in the range of S144 = 2–20 mJy; linear polarisation fractions from 7 to 82%; and absolute RMs in the 2 < |RM| < 73 rad m−2 range, Table 1. The LoTSS frequency range (120 − 168 MHz) and channel bandwidth (97.6 kHz) provide a nominal resolution in Faraday depth space (i.e., FWHM of the rotation measure spread function, RMSF; Brentjens & de Bruyn 2005) of 1.15 rad m−2. The maximum observable |RM| = 170 rad m−2 (at full sensitivity), although the Faraday depth range in the RM GRID RM synthesis processing was limited to |RM| = 120 rad m−2 (O’Sullivan et al., in prep.). The fractional linear polarisations were computed as the linearly polarised flux density ( , where Q and U represent the Stokes Q and Stokes U flux densities, after Faraday rotation correction) divided by the total intensity flux density (Stokes I) obtained from the total 8-h integration time.
The circularly polarised sources have Stokes I flux densities at 144 MHz in the range of S144 = 5 to 41 mJy and circular polarisation fractions from 2% to 22%, Table 1. The fractional circular polarisations were computed as the circularly polarised flux density (Stokes V) divided by the total intensity flux density (Stokes I) obtained from the total 8-h integration time.
We estimated the maximum DMs expected for the candidate pulsars using Galactic electron density distribution models NE2001 (Cordes & Lazio 2002) and YMW16 (Yao et al. 2017; see Table 1). These are usually below 50 pc cm−3 for the candidates at high Galactic latitudes of |b|≳30°. The largest DM predicted, 333 pc cm−3, is towards ILT J003904.45+625711.4 and close to the Galactic plane, b = 0.1°. We also estimated the largest RM expected due to Galactic Faraday rotation using the reconstruction7 from Hutschenreuter et al. (2022; see Table 1). The largest |RM| predicted, −204 rad m−2, is also towards ILT J003904.45+625711.4. In addition, we note that the LoTSS sources ILT J003904.45+625711.4 and ILT J024831.01+423020.3 are coincident with the positions of γ-ray sources 4FGL J0039.1+6257 and 4FGL J0248.6+4230, respectively, (Abdollahi et al. 2020) and these are further discussed in Sect. 5.2.
Figure 1 shows the fractional linear (left panel) or circular (right panel) polarisation plotted against total intensity flux density for all of the polarised LoTSS sources from the RM GRID (O’Sullivan et al., in prep.) or V-LoTSS (Callingham et al., in prep.). We highlight the pulsars discovered and reported in this work, along with known pulsars from the pulsar catalogue or detected in this work, and candidate sources from Table 1. This highlights the pulsar population that occupies the high fractional polarisation and relatively low flux density region of this parameter space. PSR J0218+4232 is the notable outlier in the linearly polarised sources, with a total intensity of S144 = 348.7 mJy and polarisation fraction of 47%. This is an MSP with P = 2.3 ms and relatively high DM, 61.2 pc cm−3, for this sample of pulsars, with a steep spectral index (e.g., Kondratiev et al. 2016). This source was also first identified as a steep-spectrum, highly linearly polarised point source in interferometric images (Erickson 1980; Navarro et al. 1995).
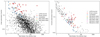 |
Fig. 1. Fractional polarisation against total intensity (Stokes I) flux density for: LoTSS sources (black points); pulsars discovered or detected through the TULIPP survey (squares); candidates observed and searched for pulsars in this work (blue circles); and known pulsars (red circles). Left: linearly polarised sources from the RM GRID (O’Sullivan et al., in prep.). Right: circularly polarised sources (absolute values) from V-LoTSS (Callingham et al., in prep.). |
3. Observations and data processing
3.1. Pulsar search observations
Each pulsar candidate was observed using the high time resolution, beam-forming observing modes of LOFAR. Signals from the HBAs of up to 24 LOFAR core stations (longest baseline 3.6 km) were coherently added in the COBALT correlator and beam former (Broekema et al. 2018) to form a single, tied-array beam with  FWHM for observing frequencies of 110 − 188 MHz. The tied-array beam data were recorded to disc as dual-polarisation, Nyquist-sampled complex voltages for 400 sub-bands of 195.3125 kHz bandwidth each. The candidate sources were observed twice, at least three days apart, for integration times of 20 min, except for the faintest sources (ILT J104140.11+542419.3 and ILT J104937.86+582217.6), for which we obtained a single 80 min integration.
3.2. Pulsar search pipelines
All of the observations were searched for pulsations using three different strategies, all employing phase-coherent dispersion removal using the GPU-accelerated CDMT software (Bassa et al. 2017a) to minimize the impact of dispersive smearing. These strategies are chosen to retain sensitivity to pulsars over a wide range of spin periods, for example, ranging from PSR J0952−0607 with P = 1.41 ms (Bassa et al. 2017b) to PSR J0250+5854 with P = 23.5 s (Tan et al. 2018a).
The first strategy is optimised for pulsars with short spin periods. Here, the complex voltages were coherently de-dispersed using CDMT to a set of trial DMs in steps of 1 pc cm−3, from DM = 0.5 pc cm−3 up to 79.5 pc cm−3 or 159.5 pc cm−3 depending on the predicted maximum dispersion measure for the coordinates of each candidate source. Filter-bank files are output with 81.92 μs of time and a 48.83 kHz frequency resolution. Radio frequency interference (RFI) was masked using the RFIFIND tool from the PRESTO software suite (Ransom 2001). The coherently de-dispersed, RFI-cleaned filter banks were then incoherently de-dispersed using the GPU-accelerated DEDISP code (Barsdell et al. 2012) around each of the coherently de-dispersed DM values (−0.5 ≤ ΔDM ≤ 0.5 pc cm−3) in steps of 0.002 pc cm−3. This approach limits the residual dispersive smearing to less than 0.24 ms, retaining sensitivity to MSPs with short spin periods. The resulting de-dispersed time series were processed using standard tools from the PRESTO software suite, which creates the power spectrum, corrects it for red noise, and then uses a GPU-accelerated version of the frequency domain acceleration method (Ransom et al. 2002) to search for periodic, and possibly accelerated, signals. The 200 pulsar candidates with the highest signal-to-noise ratio output by PRESTO were folded for visual inspection.
The second strategy is a variation of the first, where coherently de-dispersed and RFI-cleaned filter banks were generated at coarser DM steps (2.0 pc cm−3) and with coarser time (655.36 μs) and frequency (97.66 kHz) resolution. This strategy is optimised for pulsars with normal spin periods (∼1 s), which may not have passed the selection threshold of the first search strategy. These filter-bank files were incoherently de-dispersed in steps of 0.005 pc cm−3 around the coherent DM of each filter bank (−2 ≤ ΔDM ≤ 2 pc cm−3), providing a maximum dispersive smearing of 1.1 ms. These time series were searched for pulsations, but not for acceleration. Again, the 200 pulsar candidates with the highest signal-to-noise ratio output by PRESTO were folded for visual inspection.
We refer to these first and second search strategies as the ‘fast’ and ‘slow’ pipelines (i.e., more suitable to finding recycled MSPs and non-recycled pulsars), and to the filter-bank files produced as having ‘fine’ and ‘coarse’ time/frequency resolution, respectively.
The third strategy used a fast-folding algorithm (FFA) to search for long period pulsars. Here, the complex voltage data were coherently de-dispersed to a DM of 20 pc cm−3 to produce a single filter-bank file with 655.36 μs time resolution and 97.66 kHz frequency resolution. Next, using incoherent de-dispersion, de-dispersed time series were generated at steps of 0.05 pc cm−3 up to a maximum DM of 80 pc cm−3 (160 pc cm−3 for ILT J042737.00+684537.0). The RIPTIDE8 software (Morello et al. 2020) was used to perform FFA searches over four spin-period ranges: 0.3–0.75 s, 0.75–2.0 s, 2.0–5.0 s, and 5.0 s–2.0 min. Diagnostic plots were generated for up to 100 of the highest signal-to-noise ratio candidates for visual inspection.
3.3. Follow-up observations
Pulsar detections were confirmed using both LOFAR observations described in Sect. 3.1. Once confirmed, new pulsars were observed using LOFAR at a roughly monthly cadence for at least one year for the purpose of determining a phase-coherent pulsar-timing model describing the rotational and astrometric parameters, and, for those pulsars in a binary system, the binary parameters. The confirmation and timing observations are reduced using the LOFAR PULsar Pipeline (PULP) for standard observing modes including complex voltage data (e.g., Stappers et al. 2011; Kondratiev et al. 2016), which includes coherent de-dispersion and folding using DSPSR (van Straten & Bailes 2011) and outputs files in PSRFITS format. For further analysis, we used PSRCHIVE (Hotan et al. 2004) and TEMPO2 (Hobbs et al. 2006; Edwards et al. 2006). Observations of some new discoveries were also obtained with the 76 m Lovell telescope at Jodrell Bank over a 400 MHz band centred at 1532 MHz.
The DMs were measured using the PDMP routine in the PSRCHIVE software suite (Hotan et al. 2004) and refined using TEMPO2 (Hobbs et al. 2006), where possible. To measure the RMs, we used the technique of RM synthesis (Burn 1966; Brentjens & de Bruyn 2005), and the associated deconvolution procedure RM CLEAN (Heald et al. 2009), using a publicly available Python package9 and following the procedure used in Sobey et al. (2019). The frequency range (110 − 188 MHz) and channel bandwidth (195 kHz) provide a nominal resolution in Faraday depth space (i.e., FWHM of the RMSF) of 0.8 rad m−2, and maximum observable |RMs| = 65 and 162 rad m−2 (at full and 50% sensitivity, respectively; Brentjens & de Bruyn 2005).
The data were corrected for the DMs and RMs (where significantly measured), before constructing the time- and frequency-averaged polarisation pulse profiles. The pulse-integrated fractional polarisation measurements were obtained using the time- and frequency-averaged polarisation pulse profiles, as the sum of the linearly/circularly polarised flux density divided by the total intensity flux density over each significant (> 3 × rms) on-pulse phase bin (e.g., Noutsos et al. 2015).
The ionospheric Faraday rotation contribution to the RM measured was computed and subtracted for each observing epoch using the publicly available software IONFR10 (Sotomayor-Beltran et al. 2013), with inputs from the International GNSS Service global ionospheric total electron content maps11 (e.g., Hernández-Pajares et al. 2009; Noll 2010) and the International Geomagnetic Reference Field12 (IGRF-13; Thébault et al. 2015).
4. Results
We discovered two new radio pulsars, PSRs J1049+5822 and J1602+3901, at the locations of the linearly and circularly polarised sources ILT J104937.86+582217.6 and ILT J160218.84+390101.8, respectively, which is summarised in Table 2. These sources are further discussed below.
Pulsars discovered or independently re-discovered (detected) in the TULIPP survey.
In addition, we also detected a further five known radio pulsars, summarised in Table 2, which were not among the over 40 known pulsars detected as polarised sources in LoTSS and excluded from the candidate list. These pulsars were previously discovered using large, sensitive antennas operating between 111 and 430 MHz. While these detected pulsars were known at the time of the TULIPP pulsar candidate selection from the LoTSS polarised sources, (sub-)arcsecond pulsar timing positions for these sources were not available in the literature. Instead, their positions were known to the nearest minute in right ascension and degree in declination, meaning it was not, a priori, clear if a source matched the LoTSS pulsar candidate (with a positional accuracy at the arcsecond level). Only after the spin period and DM were determined from the LOFAR observations was it possible to unambiguously associate the signal with a previously known pulsar.
4.1. PSR J1049+5822
PSR J1049+5822 was discovered using the FFT-based periodicity search in the slow pulsar search pipeline in the 80 min observation of the linearly polarised source ILT J104937.86+582217.6. The FFA algorithm also detected this pulsar. The pulsar has a spin period P = 0.7276 s at a dispersion measure of DM = 12.364 pc cm−3. For this line of sight and DM, the NE2001 (Cordes & Lazio 2002) and YMW16 (Yao et al. 2017) Galactic electron density models predict distances of 0.56 and 1.1 kpc, respectively
Figure 2 presents the polarisation data for PSR J1049+5822, showing the LoTSS image from interferometric LOFAR observations, the polarised pulse profile using the beam-formed LOFAR observations, as well as the Faraday spectra obtained from both of these observations. The RMs and the linear polarisation fractions measured using both the LoTSS and beam-formed data show good agreement (see Tables 1 and 2), confirming that this pulsar is indeed the LoTSS source. The RM measured towards the pulsar is also ∼40% of the maximum RM expected from the entire Galactic line of sight (see Table 1).
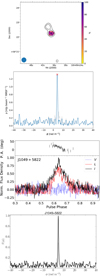 |
Fig. 2. Properties of ILT J104937.86+582217.6/PSR J1049+5822 discovered in the TULIPP survey, where the panels show the following (top to bottom). (1) LoTSS image at a centre frequency of 144 MHz with a 20″ resolution, contours show the total intensity starting at 0.5 mJy beam−1 and increase by factors of 2, and colours show fractional linear polarisation with peak of 63.5%; the beam size is shown at the lower left corner. The extension to the north is due to another unrelated radio source in LoTSS. (2) Faraday spectrum (original – grey dashed line; RM CLEANed – blue line) computed from RM GRID processing of the LoTSS polarisation image data. The red cross shows the peak corresponding to the RM = 4.11 rad m−2. (3) Folded polarisation pulse profile, showing the normalised flux density (arbitrary units) for total intensity (Stokes I, black line), linear polarisation (L, red dashed line), and circular polarisation (V, blue dotted line), and the polarisation position angle (arbitrary average offset from 0°). (4) Faraday spectrum (original – grey line; RM CLEANed – black line) computed using PSR J1049+5822 pulsar observations. The grey dashed line shows the RM CLEAN component at 4.732 ± 0.016 rad m−2, prior to the ionospheric RM correction. |
We obtained a pulsar timing solution based on LOFAR observations spanning a period of 1.9 yr, Table 3 provides a summary of PSR J1049+5822’s properties based on pulsar timing, and Fig. 3 shows the pulsar timing residuals, output from the TEMPO2 software. The timing solution constrains the spin-period derivative to Ṗ = 3.905(3) × 10−15 s s−1 and provides an arcsecond pulsar-timing position. The pulsar-timing position we measured is in good agreement with the position determined from the LoTSS images, with an offset of  and
and  .
.
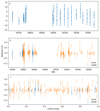 |
Fig. 3. Pulsar timing residuals from the timing models in Table 3 for PSR J1049+5822 (a) and PSR J1630+3550 (b) as a function of time, and PSR J1630+3550 as a function of orbital phase (c). |
Parameters for PSR J1049+5822 and PSR J1630+3550 based on pulsar timing.
4.2. PSR J1602+3901
PSR J1602+3901 was discovered using the first pulsar search pipeline strategy, applied to a 20 min observation of the circularly polarised source ILT J160218.84+390101.8. The pulsar has a spin period of P = 3.71 ms at a dispersion measure of DM = 17.259 pc cm−3. For this line of sight and DM, the NE2001 and YMW16 Galactic electron density models predict distances of 1.2 and 1.6 kpc, respectively.
The polarisation properties of PSR J1602+3901 are shown in Fig. 4. The circular polarisation fractions, measured using the imaging and beam-formed data, agree within the uncertainties (see Tables 1 and 2). The beam-formed pulsar data were searched for linear polarisation using RM synthesis, but no significant detection was found. If the emission from PSR J1602+3901 were more than a few per cent linearly polarised, we likely would have detected this, as the maximum RM expected from this Galactic line of sight (Table 1) is less than the maximum RM detectable with full sensitivity using these LOFAR data (Sect. 3.3).
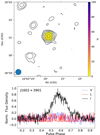 |
Fig. 4. Properties of ILT J160218.82+390101.5/PSR J1602+3901 discovered in the TULIPP survey. The top panel shows LoTSS image at a centre frequency of 144 MHz with a 20″ resolution, where contours show total intensity starting at 0.5 mJy beam−1 and increase by factors of 2, and colours show fractional circular polarisation with peak of 9%. The beam size is shown in the lower left corner. The bottom panel shows the polarisation pulse profile. The normalised flux density (arbitrary units) is shown for total intensity (Stokes I, black line), linear polarisation (L, red dashed line), and circular polarisation (V, blue dotted line). Polarisation position angles are not shown, because no linear polarisation was detected above 3× the rms of the off-pulse baseline. |
Spin period measurements show that PSR J1602+3901 is part of a binary system with an orbital period of Pb = 6.32 d. The binary companion is of low mass (Mc ∼ 0.1 M⊙) and likely a Helium core white dwarf. The LoTSS source location is  offset from SDSS J160218.77+390101.6, an r = 21.0 object classified as a stellar object (Alam et al. 2015) whose colours are a closer match to those of main-sequence stars than those of white dwarfs. The source positions are marginally consistent at
  ,
,  , suggesting that a chance coincidence cannot be ruled out. Hence, further timing observations are required to obtain a coherent timing solution describing the astrometric, rotational, and binary parameters, and to improve the astrometric matching. The results of these timing observations will be presented in a future publication (Bassa et al., in prep.).
4.3. PSR J1630+3550
PSR J1630+3550 is a millisecond pulsar with a P = 3.229 ms spin period at a dispersion measure of DM = 17.455 pc cm−3. This pulsar was originally discovered in the Arecibo drift scan survey at 327 MHz (AO327; Deneva et al. 2013). While the pulsar is not yet published in the ATNF pulsar catalogue, its provisional name (PSR J1630+35), spin period, and DM are reported on the AO327 discoveries page13. We independently re-discovered this pulsar in the observations of the linearly polarised source ILT J163035.93+355042.5. It was detected in both of the FFT-based search pipelines that use fine and coarse time/frequency resolution filter banks. The NE2001 and YMW16 Galactic electron density models predict distances of 1.1 and 1.6 kpc, respectively, for the position and DM of PSR J1630+3550.
The measured RMs and linear polarisation fractions from the LoTSS imaging and TULIPP beam-formed observations show excellent agreement within the uncertainties, see Tables 1 and 2 and Fig. 5, confirming that this pulsar is indeed the LoTSS source. The RM measured towards the pulsar is ∼65% of the maximum RM expected from the entire Galactic line of sight.
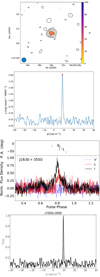 |
Fig. 5. Properties of ILT J163035.93+355042.5/PSR J1630+3550, where the panels show the following (top to bottom). (1) LoTSS image at a centre frequency of 144 MHz with a 20″ resolution, contours show total intensity starting at 0.5 mJy beam−1 and increase by factors of 2, and colours show fractional linear polarisation with a peak of 32%. The beam size is shown at the lower left corner. (2) Faraday spectrum (original – grey dashed line; RM CLEANed – blue line) computed from RM GRID processing using the LoTSS polarisation image data. The red cross shows the peak at 8.65 rad m−2. (3) Folded polarisation pulse profile from a 20-min observation at 149 MHz with 78 MHz bandwidth and 512 pulse profile bins. Lower panel: normalised flux density (arbitrary units) for total intensity (Stokes I, black line), linear polarisation (L, red dashed line), and circular polarisation (Stokes V, blue dotted line). Upper panel: polarisation position angle (arbitrary average offset from 0 deg). (4) Faraday spectrum (original – grey line; RM CLEANed – black line) computed using PSR J1630+3550 pulsar data. The grey dashed line shows the RM CLEAN component at 9.486 ± 0.025 rad m−2, prior to the ionospheric RM subtraction. |
The discovery and confirmation observations of PSR J1630+3550 showed a small but non-zero acceleration, indicating that the pulsar could be part of a binary system. We used further follow-up pulsar timing observations using both LOFAR and Lovell telescopes and the TEMPO2 software to confirm the binary nature of this pulsar. Table 3 provides the properties of the pulsar and its binary system from timing observations, while Fig. 3 shows the pulsar timing residuals. PSR J1630+3550 is orbiting a 0.009 M⊙ companion in a 7.58 h orbit, assuming a pulsar mass of 1.4 M⊙. These parameters suggest that PSR J1630+3550 is part of the black-widow-class of binary millisecond pulsars, where the companion is irradiated by the energetic wind from the pulsar (e.g., Chen et al. 2013; Polzin et al. 2020). The pulsar timing position we measured (Table 3) and the position determined from the LoTSS images (Table 1) are also in agreement within the uncertainties ( ,
,  ). No source is coincident with the position of the pulsar in the Pan-STARRS1 survey images (Chambers et al. 2016).
4.4. Other known pulsars detected
We independently re-discovered a further four previously known pulsars: PSRs J0220+3626, J0742+4110, J2212+2450, and J2227+3038. All were selected as circularly polarised LoTSS sources (see Tables 1 and 2).
PSR J0220+3626 was originally discovered by Tyul’bashev et al. (2016) using the Pushchino Large Phased Array (LPA) telescope at 111 MHz, providing a positional accuracy of order 15′. Its position, spin period, and DM are consistent with our measurements; though, due to the small receiver bandwidth, Tyul’bashev et al. (2016) could only constrain the DM to a value between 30 and 50 pc cm−3. PSR J0742+4110 is an MSP that is not yet published, discovered in the Green Bank North Celestial Cap (GBNCC) pulsar survey using the Robert C. Byrd Green Bank Telescope (GBT) at 350 MHz (Stovall et al. 2014). The GBNCC discovery web page14 reports it as PSR J0740+41, with a spin period of P ∼ 3.14 ms and DM ∼ 21 pc cm−3, consistently with our measurements. Similarly, PSR J2212+2450 is an MSP that is not yet published, discovered by the Arecibo AO327 survey (Deneva et al. 2013). The AO327 discovery web page reports it as PSR J2212+24 with parameters consistent with our measurements (P = 3.91 ms and DM = 25.2 pc cm−3). Finally, Camilo et al. (1996) discovered PSR J2227+3038 as PSR J2227+30 using Arecibo observations at 430 MHz taken in 1994. The spin period and DM reported are consistent with our measurements (P = 0.842 s and DM = 33 pc cm−3).
The LOFAR polarisation pulse profiles for these four pulsars are shown in Figs. 6 and 7. The circular polarisation fractions of PSRs J0220+3626 and J2227+3038 are consistent within uncertainties between the LoTSS and the pulsar data (Tables 1 and 2). No linear polarisation was detected from PSRs J0220+3626, J0742+4110, or J2212+2450 after processing the data using RM synthesis. Similarly to PSR J1602+3901, if the emission from PSR J0220+3626 were ≳10% linearly polarised, we likely would have detected this, as the maximum RM expected from the Galactic line of sight (Table 1) is less than the maximum RM detectable at 50% sensitivity with these LOFAR observations (Sect. 3.3). No polarised emission could be detected from PSRs J0742+4110 or J2212+2450 due to the lower signal-to-noise ratio of their average pulse profiles.
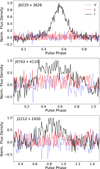 |
Fig. 6. Polarisation pulse profiles for known PSRs J0220+3626 (upper), J0742+4110 (middle), and J2212+2450 (lower), respectively, detected in the TULIPP survey. Each was obtained using 20-min observations at a centre frequency of 149 MHz with a 78 MHz bandwidth, and 256, 128, and 128 pulse profile bins, respectively. The normalised flux density (arbitrary units) is shown for total intensity (Stokes I, black lines), linear polarisation (L, red dashed lines), and circular polarisation (Stokes V, blue dotted lines). Polarisation position angles are not shown, because no linear polarisation was detected above 3 × rms of the off-pulse baseline. |
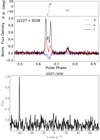 |
Fig. 7. Properties of the known PSR J2227+3038 detected in the TULIPP survey. Upper: polarisation pulse profile obtained from a 20-min observation at a centre frequency of 149 MHz with a 78 MHz bandwidth and 1024 pulse profile bins, showing the normalised flux density (arbitrary units) for total intensity (Stokes I, black line), linear polarisation (L, red dashed line), circular polarisation (Stokes V, blue dotted line), and polarisation position angle (arbitrary average offset from 0 deg). Lower: faraday spectrum (original – grey line; RM CLEANed – black line) computed using PSR J2227+3038 pulsar data. The grey dashed line shows the RM CLEAN component at −59.04 ± 0.03 rad m−2, prior to the ionospheric RM subtraction. |
PSR J2227+3038 shows relatively high fractional linear polarisation and the RM was significantly detected in both LOFAR pulsar search observations (see Table 2 and Fig. 7). The associated source ILT J222741.76+303820.8 in the LoTSS image is weakly detected but is too faint to be included in the RM GRID catalogue with an S/N < 7. However, after manual inspection of the data, we measure an RM = −58.7 ± 0.1 rad m−2 and fractional linear polarisation of ≈6%. The RMs we measured towards PSR J2227+3038 are in good agreement within the uncertainties and with the measurement published in the ATNF pulsar catalogue: −58.3 ± 1.9 rad m−2 (Ng et al. 2020). PSR J2227+3038 shows a steep ‘S’-shaped curve in the polarisation position angle (P.A.) with a pulse phase across the main pulse with a range ≈130° and a highly linearly polarised post-cursor component with approximately flat P.A.s (Fig. 7). The P.A. range across the main pulse profile is larger than for PSRs J1049+5822 and J1630+3550, the other pulsars detected in linear polarisation, which have relatively flat P.A. swings across their pulse profiles. The LoTSS data provide the average measurement across the pulse profile, and this P.A. range likely acts to de-polarise the signal, accounting for the lower linear fractional polarisation measured in the RM GRID data (e.g., Posselt et al., in prep.).
5. Discussion
5.1. Pulsars (re-)discovered in TULIPP
During the first year of the TULIPP survey, we discovered two new pulsars and detected a further five known pulsars towards either linearly or circularly polarised LoTSS point sources. The pulsars presented in this work have been characterised using both LOFAR imaging and beam-forming modes (Tables 1 and 2). The pulsars we detected have spin periods between P = 3.1 ms and 1.03 s, dispersion measures between DM = 12 pc cm−3 to 45 pc cm−3, and 144 MHz flux densities in the range of S144 = 2.1 mJy to 24 mJy. In general, the measured properties using both the imaging and beam-formed data are in agreement, including the sky coordinates (for PSRs J1049+5822 and J1630+3550), fractional polarisations, and RMs. Although, we do not necessarily expect the fractional polarisation measurements to agree (e.g., PSR J2227+3038), because the beam-formed observations provide pulse phase-resolved information, within which the polarised flux densities and P.A.s vary, while the imaging measurements provide the average across the pulse profile. We did not measure flux densities using the beam-formed data, because the imaging data are more reliable and provide smaller uncertainties (e.g., Bilous et al. 2016). We also did not present the in-band spectral indices using the imaging or beam-formed data, because the uncertainties are large. We are collecting multi-wavelength data, which will provide more reliable wide-band radio spectra and will be presented in future work.
Only one of the pulsars, PSR J2227+3038, shows significant emission in both linear and circular polarisations. It also shows the most complex pulse profile, with reasonably narrow triple-peaked main pulse and post-cursor components. The other pulsars generally show a reasonably wide (relatively large duty cycle), single-peaked pulse profile with either significant linear or circular polarisation. This is not unusual for the MSPs, but it is somewhat less common for the non-recycled pulsars PSRs J0220+3626 and J1049+5822 (e.g., Kramer et al. 1998; Pilia et al. 2016; Kondratiev et al. 2016). Furthermore, the pulse profile of PSR J0742+4110 shows the largest duty cycle (∼70%) for this set of pulsars and appears to be quite heavily affected by interstellar scattering. No higher frequency pulse profiles are published to further investigate this.
LOTAAS pointings towards all of the candidate sources in Table 1 have already been observed, but no pulsar was identified in the majority of these data. However, the non-recycled pulsars PSRs J0220+3626 and J2227+3038 (spin periods of P = 1.029 s and P = 0.842 s) that were detected in this work were also detected in the LOTAAS survey (Sanidas et al. 2019). These sources have higher flux densities (S144 > 15 mJy) than PSR J1049+5822, the non-recycled pulsar that was discovered in the TULIPP survey. PSR J1049+5822 lies in the P − DM − S parameter space where LOTAAS discovered or detected known pulsars (Sanidas et al. 2019). However, due to the low flux density of S144 = 2.0 mJy, the integration time (1 h), and number of LOFAR HBA stations used in the LOTAAS observations (6), the expected signal-to-noise ratio of PSR J1049+5822 is ≈8, and near the LOTAAS detection significance threshold. Folding and dedispersing the LOTAAS observation containing PSR J1049+5822 with the timing solution from Table 3 did not lead to a significant detection.
This work also highlights the potential for discovering MSPs through TULIPP. Due to the coarse time resolution of the LOTAAS survey, its sensitivity to detect MSPs was significantly reduced compared to the observational setup of TULIPP. The six known MSPs that were detected in LOTAAS are relatively bright (> 25 mJy) and have relatively long spin periods (P > 4.2 ms) and relatively low DMs (DM ≤ 18.3 pc cm−3); the shortest spin period pulsar discovered using LOTAAS is PSR J0827+53, a binary MSP with P = 13.5 ms and DM = 23.1 pc cm−3 (Sanidas et al. 2019). Known non-recycled pulsars, and MSPs with spin periods 2 < P < 6 ms, have been detected in the LoTSS linear polarisation images (O’Sullivan et al., in prep.). All of these non-recycled pulsars were also detected in the LOTAAS survey, while 70% of these MSPs, all with spin periods P < 4.2 ms, were not detected (Sanidas et al. 2019). The MSPs PSRs J0742+4110, J1630+3550, and J2212+2450 with spin periods P < 3.9 ms, which were detected in this work, were not detected in LOTAAS due to its reduced sensitivity to fast-spinning pulsars.
New pulsars discovered using the low-frequency LOFAR observations also provide precise DM measurements, in addition to the precise RM measurements from the LoTSS RM GRID. Since pulsar DMs and RMs are an efficient method for estimating the average Galactic magnetic field strength and direction parallel to the line of sight (e.g., Sobey et al. 2019), these provide more data that point towards reconstructing the Galactic magnetic field in 3D, particularly towards the Galactic halo, which is relatively unexplored (e.g., Terral & Ferrière 2017).
5.2. Non-detection of other polarised sources as pulsars
Although we have successfully (re-)discovered pulsars in the TULIPP survey using the methods outlined here, there are seven linearly polarised and 16 circularly polarised sources that we have not discovered pulsations towards (Table 1). This may be due to several factors that are briefly described below, which include intrinsic emission beam geometry or variability, extrinsic variability and other ionised ISM propagation effects, instantaneous observing sensitivity, or sources that are not pulsars. Similar discussions of these factors have also been presented in the literature (e.g., Crawford et al. 2000, 2021; Hyman et al. 2019; Maan et al. 2018).
We attempted to minimise effects due to variability in flux density with time by repeating observations of the sources twice. This provided the opportunity to sample different interstellar scintillation conditions, emission states (in case of nulling or mode-changing, e.g., Wang et al. 2007), or binary period phases (e.g., black widow/redback binary systems show eclipses during some binary period phases; e.g., Camilo et al. 2015; Polzin et al. 2020). Although diffractive scintillation bandwidths are small at these low observing frequencies, and therefore the effect is often averaged out over the large bandwidth, refractive scintillation can cause the flux density to vary by a factor of a few on longer timescales (e.g., Cordes & Rickett 1998; Archibald et al. 2014; Kumamoto et al. 2021). In future, a check could be carried out to ensure that the source is indeed still visible at the time of the beam-formed observations using the interferometric imaging mode simultaneously (e.g., Polzin et al. 2020). If these candidate sources are too accelerated to be detected in the pulsar observations, they may be pulsars in very short binary period systems, which are important for testing general relativity (e.g., Cameron et al. 2018); yet, the most accelerated systems consisting of two neutron stars are typically found at low Galactic latitude. If this is the case, different approaches to searching for pulsars in this data may be required, for example, template matching or other novel search methods (Balakrishnan et al. 2021). Moreover, observations with telescopes with greater instantaneous sensitivity could also prove fruitful, although this may not be possible until the SKA–Low is constructed (for sources visible in the southern hemisphere).
As the impulsive signals from pulsars traverse the ISM, they become dispersed and scattered. We can effectively correct for the dispersion in the data that we record up to relatively large dispersion measures. For example, the LOTAAS survey was able to discover and detect non-recycled pulsars (with P > 1 s) up to a maximum DM of 131 and 217 pc cm−3, respectively (Sanidas et al. 2019). However, the broadening of pulse profiles due to interstellar scattering in the anisotropic ISM can become severe at low frequencies, and we are not yet able to remove this effect from the data we collect for pulsar searches. Intervening structures in the ISM, acting as scattering screens, influence the propagation of pulsar emission (e.g., supernova remnants, H II regions; e.g., Mitra et al. 2003; Johnston & Lower 2021; Sobey et al. 2021). Interstellar scattering times are proportional to wavelength to the power of ∼4 (e.g., 4.4, assuming uniform Kolmogorov turbulence in the ISM, e.g., Geyer et al. 2017), and they are correlated with DMs (e.g., Oswald et al. 2021, and references therein). Detecting pulsars in continuum images is not affected by the DMs or scattering times of the pulsars. For example, the POlarised GLEAM Survey using the Murchison Widefield Array (MWA) at 169–231 MHz (Riseley et al. 2020) detected bright, polarised pulsars with larger DMs (up to 515 pc cm−3) compared to those detected using the MWA’s high time resolution mode (up to 158.52 pc cm−3; Xue et al. 2017). If the polarised LoTSS sources are MSPs with large DMs (significant fractions of those predicted using the Galactic electron density models) then conducting search observations at slightly higher observing frequencies, where these ISM propagation effects are less severe, may prove fruitful. In this case, the spectral index of the sources should also be taken into account (e.g., Camilo et al. 2021). Most of the candidates searched in this work are towards Galactic latitudes of |b|> 13° (Table 1), where scattering times are relatively small compared to those towards the Galactic plane (e.g., Yao et al. 2017). Candidates that are located closer to the Galactic plane, including ILT J003904.45+625711.4 at |b| = 0.12°, may require deeper follow-up observations at higher frequencies.
Two TULIPP candidates coincident with γ-ray sources have indeed been searched for radio pulsations at higher radio frequencies. The linearly polarised source ILT J024831.01+423020.3, coincident with 4FGL J0248.6+4230 (Abdollahi et al. 2020), was (more recently than our TULIPP observations) discovered to be an MSP (PSR J0248+4230) using a 30-min Giant Metrewave Radio Telescope (GMRT) observation at 322 MHz (Bhattacharyya et al. 2021). PSR J0248+4230 is an isolated MSP with P = 2.6 ms, DM = 48.2 pc cm−3 (the pulse profile shows significant dispersion smearing at 322 MHz), a steep spectral index (α = −3.3), and < 2σ agreement between the sky positions from the LoTSS and GMRT images (Bhattacharyya et al. 2021). After we re-examined the PRESTO outputs from the two LOFAR observations of ILT J024831.01+423020.3, we found that PSR J0248+4230 was only detected as a 9σ candidate (ranked 29 out of 200) in one observation. The pulse profile is visibly affected by interstellar scattering and is only detectable at the highest frequencies of the LOFAR band (ν > 140 MHz). This candidate was not selected for further follow-up observations due to the low significance of the detection for a source with a total flux density of 9 mJy, combined with its absence from the second observation, which can be relaxed in future analyses. Additionally, the circularly polarised source ILT J003904.45+625711.4 is coincident with 3FGL J0039.3+6256 (4FGL J0039.1+6257; Abdollahi et al. 2020) and was predicted to be an MSP using machine-learning techniques (Saz Parkinson et al. 2016); although, a pulsar search using 8-min GBT observations at 2 GHz did not detect pulsations (Sanpa-arsa 2016). This adds to the demonstration of the high quality of the TULIPP candidates identified and the potential for follow-up observations at higher frequencies.
Alternatively, there is a possibility that we cannot detect pulsations from sources because the radio emission does not vary with rotational spin, including neutron stars/pulsars with aligned rotation and magnetic axes pointed directly towards our line of sight. In this case, searching the polarisation data using the Stokes Q, U, and V parameters may provide an additional avenue, as these may be more likely to vary with spin phase in this case (e.g., following the rotating vector model, RVM; Radhakrishnan & Cooke 1969). However, this geometry may also reduce the average degree of linear polarisation that we measure using the LoTSS images, and it may not apply to significantly polarised sources (e.g., Crawford et al. 2000).
It is unlikely that the polarised LoTSS sources were not detected, because the pulsar radio emission beam does not intersect our line of sight. However, it is still debated whether there is unpulsed continuum emission from pulsars (e.g., Navarro et al. 1995, for PSR J0218+4232), and unpulsed emission detected may be due to pulsar wind nebulae (plerions), supernova remnants, or other structures in the ISM (e.g., Ravi & Deshpande 2018, and references therein).
High fractional linear and/or circular polarisation is a well-known continuum property of pulsars and has resulted in previous pulsar discoveries as outlined in Sect. 1, and it is mostly unique for radio sources. However, other sources of polarised emission exist, including rare flare stars, star-planet interactions, ultracool dwarfs, radio galaxies, and blazars (e.g., O’Sullivan et al. 2013; Vedantham et al. 2020; Pritchard et al. 2021; Callingham et al. 2021). These linear and circularly polarised sources will be further discussed in O’Sullivan et al. (in prep.) and Callingham et al. (in prep.), respectively. For the linearly polarised candidates that we discovered/detected as pulsars, both have measured RMs < 65% of that expected from the Galactic line-of-sight, Table 1. Although five linearly polarised candidates have measured RMs larger than that expected from the Galactic line of sight, only ILT J042737.00+684536.9 is over 1σ larger, taking into account the uncertainties. This source may be, e.g., a compact radio galaxy, as it also has a relatively low linear polarisation fraction. However, RMs towards pulsars show varying agreement with the RMs from the entire Galactic line of sight (e.g., Sobey et al. 2019). Notably, a candidate with the highest fractional linear polarisation and two candidates with the highest circular polarisation fractions were not detected as pulsars, making them particularly interesting for further investigation into the source(s) of their emission.
5.3. Future prospects
The TULIPP pulsar discovery rate is two pulsars, one of which is an MSP, and the pulsar detection rate is a further five pulsars (including 3 MSPs), in 21 h of LOFAR observations. However, over 40 known pulsars, half of which are MSPs, were identified as polarised point sources in the LoTSS data and excluded from the TULIPP survey observations. The LOTAAS discovery rate is 74 pulsars (including 2 MSPs), and the pulsar detection rate is a further 311 pulsars (including 6 MSPs), in 1910 h of observations (Sanidas et al. 2019). In terms of pulsars discovered per hour of LOFAR observations, the first year of the TULIPP survey has been more efficient, particularly for short-period MSPs, compared to the LOTAAS all-sky survey. LOTAAS has surveyed the northern sky above a 0° declination, while TULIPP has observed  fields containing polarised sources that were catalogued using ∼150 LoTSS fields that cover ∼2400 deg2 of sky. As the TULIPP survey progresses, we will be able to more fully compare and contrast these complementary surveys, in terms of efficiency in telescope time and sky area surveyed.
The LOFAR discovery of the new pulsars, PSRs J1049+5822 and J1602+3901, by following up linearly and circularly polarised point sources identified in LOFAR images adds to the pulsar discovered in the 3C 196 observations taken by the Epoch of Reionisation LOFAR Key Science Project (Jelić et al. 2015). These and similar discoveries using other telescopes summarised in Sect. 1 show the value of targeted follow-up of polarised point sources in continuum imaging as a method of discovering new pulsars. However, this method of following up linearly and circularly polarised sources in the imaging domain could miss pulsars with pulse profiles that show large swings in the P.A., show swings between handedness in circular polarisation, as expected from the core of the pulsar emission beam (Everett & Weisberg 2001; Melrose & Luo 2004, and references therein), or that are not significantly polarised at all. Furthermore, as the LoTSS survey expands towards lower Galactic latitudes, we may see a decrease in the number density of linearly polarised sources, due to larger |RMs|, although the circularly polarised emission will not be affected. We can investigate if this effects detecting known pulsars, and, therefore, the prospects for identifying pulsar candidates. Furthermore, there are alternative methods and prospects for identifying promising pulsar candidates in continuum images including following up sources that show variability, steep-spectral indices, or associations with ISM structures such as supernovae or pulsar wind nebulae (e.g., Dai et al. 2017, 2018; Schinzel et al. 2019; Hyman et al. 2021).
PSR J1049+5822 appears to be a reasonably typical non-recycled pulsar, located in the middle of the pulsar island in the P − Ṗ diagram. Thus, it seems there are more pulsars to be discovered in this region of the pulsar parameter space, as expected when using increasingly sensitive observations from SKA precursors/pathfinders. This will continue to help us understand the Galactic population of pulsars, and the potential discoveries in future pulsar surveys using the SKA (e.g., Keane et al. 2015; Xue et al. 2017).
All of the LoTSS DR2 data have now been processed through the RM GRID pipeline and will be summarised in O’Sullivan et al. (in prep.). TULIPP is now a long-term LOFAR observing project, and we have more recently observed tens of more linearly polarised and circularly polarised pulsar candidate sources. As the LoTSS observations continue to observe larger sky areas, particularly extending further towards the Galactic plane, and eventually covering the entire northern sky (Shimwell et al. 2019), we can expect additional promising pulsar candidates to follow up using LOFAR beam-formed observations. Following this, the upgrade to LOFAR2.0 will enable more sensitive sky surveys by facilitating observations using all low band antenna dipoles and HBAs simultaneously, and commensal imaging and beam-formed observations. There are additional prospects to identifying candidates, including using lower flux-density-limit thresholds for the polarised LoTSS sources, and increasing the sensitivity of the polarisation images by processing the LoTSS data products at a 6″ resolution and creating mosaicked images from the individual fields.
More generally, we have demonstrated that a targeted pulsar search of polarised point sources at low frequencies can successfully and relatively efficiently discover pulsars, including MSPs. Therefore, this method shows promise for other SKA precursor/pathfinder facilities, and, in future, the SKA. Indeed, such a targeted pulsar search accompanying a sensitive SKA polarisation imaging survey may be particularly productive in discovering MSPs, while an all-sky pulsar search using coherent de-dispersion remains computationally infeasible. In the meantime, understanding pulsar properties in continuum images can provide valuable input for even more efficient classification of radio sources and the identification of promising pulsar candidates, for example, as a potential classifier in machine learning approaches (Tan et al. 2018b; Galvin et al. 2020; Mostert et al. 2021).
6. Summary and conclusions
We describe the TULIPP (targeted search using LoTSS images for polarised pulsars) pulsar survey and present the results from the first year of LOFAR observations in observing semesters LC12 and LC13 (2019 June 1 – 2020 May 31). We summarise this work as follows.
-
We identified 30 promising pulsar candidates (excluding over 40 known pulsars) using LOFAR Two-Metre Sky Survey (LoTSS) linear and circular polarisation images. The selection criteria included the requirements that sources were unresolved in the 20 and 6″ total intensity images, with greater than 7% linear or 1% circular fractional polarisation.
-
We followed up nine linearly polarised sources and 21 circularly polarised pulsar-candidate sources using 21 h of LOFAR tied-array beam-formed observations centred at 149 MHz. The data were processed using three independent pulsar search pipelines.
-
During the first year of the TULIPP survey, we discovered two pulsars: PSR J1049+5822 is a ‘slow’ pulsar with spin period of P = 0.7276 s and dispersion measure of DM = 12.364 pc cm−3. PSR J1602+3901 is an MSP with spin period of P = 0.0037 s and dispersion measure of DM = 17.259 pc cm−3.
-
We also independently re-discovered (detected) a further five known pulsars that did not have well-localised sky positions: ‘slow’ pulsars PSRs J0220+3626, and J2227+3038; and MSP PSRs J0742+4110, J1630+3550 and J2212+2450.
-
We conducted further observations for PSRs J1049+5822 and J1630+3550 and presented the parameters measured using pulsar timing. We found that PSR J1630+3550 is part of a 7.58-h orbital period binary system with a low-mass companion, suggesting it is a ‘black-widow’ binary MSP system.
-
We presented the polarisation pulse profiles of the pulsars we detected in the TULIPP data and further discussed their properties. We also discussed potential reasons for non-detections of pulsars towards the other candidate sources, the future prospects for the TULIPP survey, and using this methodology for future targeted pulsar searches including those using SKA observations.
Our results demonstrate that pulsars, and particularly MSPs, can be relatively efficiently discovered using this targeted pulsar search method.
We use the convention Sν ∝ να, where flux density, S, is proportional to observing frequency, ν.
psrcat version 1.65 accessed at http://www.atnf.csiro.au/research/pulsar/psrcat/
Acknowledgments
This paper is based on data obtained with the International LOFAR Telescope (ILT) under project codes LC12_003, LC13_006 as well as LT10_015 and LT14_005. LOFAR (van Haarlem et al. 2013) is the Low Frequency Array designed and constructed by ASTRON. It has observing, data processing, and data storage facilities in several countries, that are owned by various parties (each with their own funding sources), and that are collectively operated by the ILT foundation under a joint scientific policy. The ILT resources have benefitted from the following recent major funding sources: CNRS-INSU, Observatoire de Paris and Université d’Orléans, France; BMBF, MIWF-NRW, MPG, Germany; Science Foundation Ireland (SFI), Department of Business, Enterprise and Innovation (DBEI), Ireland; NWO, The Netherlands; The Science and Technology Facilities Council, UK. We thank the anonymous referee and Phil Edwards for comments that improved the manuscript. We thank Dale Frail and Paul Ray for providing information on gamma-ray and Fermi Pulsar Search Consortium data. J.W.T.H., C.G.B. and V.I.K. acknowledge funding from an NWO Vidi fellowship and ERC Starting Grant “DRAGNET” (337062). J.W.T.H. also acknowledges funding from an NWO Vici grant (“AstroFlash”; VI.C.192.045). M.H. acknowledges funding from the European Research Council (ERC) under the European Union’s Horizon 2020 research and innovation programme (grant agreement No 772663). This work used the PYTHON packages: ASTROPY (Astropy Collaboration 2013, 2018), MATPLOTLIB (Hunter 2007), NUMPY (Harris et al. 2020). This research has made use of NASA’s Astrophysics Data System Bibliographic Services.
References
- Abdo, A. A., Ackermann, M., Ajello, M., et al. 2010, A&A, 524, A75 [NASA ADS] [CrossRef] [EDP Sciences] [Google Scholar]
- Abdollahi, S., Acero, F., Ackermann, M., et al. 2020, ApJS, 247, 33 [Google Scholar]
- Alam, S., Albareti, F. D., Allende Prieto, C., et al. 2015, ApJS, 219, 12 [Google Scholar]
- Anderson, C. S., Gaensler, B. M., Feain, I. J., & Franzen, T. M. O. 2015, ApJ, 815, 49 [Google Scholar]
- Antoniadis, J. 2021, MNRAS, 501, 1116 [Google Scholar]
- Antoniadis, J., Freire, P. C. C., Wex, N., et al. 2013, Science, 340, 448 [Google Scholar]
- Archibald, A. M., Kondratiev, V. I., Hessels, J. W. T., & Stinebring, D. R. 2014, ApJ, 790, L22 [NASA ADS] [CrossRef] [Google Scholar]
- Archibald, A. M., Gusinskaia, N. V., Hessels, J. W. T., et al. 2018, Nature, 559, 73 [Google Scholar]
- Astropy Collaboration (Robitaille, T. P., et al.) 2013, A&A, 558, A33 [NASA ADS] [CrossRef] [EDP Sciences] [Google Scholar]
- Astropy Collaboration (Price-Whelan, A. M., et al.) 2018, AJ, 156, 123 [Google Scholar]
- Atwood, W. B., Abdo, A. A., Ackermann, M., et al. 2009, ApJ, 697, 1071 [CrossRef] [Google Scholar]
- Backer, D. C., Kulkarni, S. R., Heiles, C., Davis, M. M., & Goss, W. M. 1982, Nature, 300, 615 [NASA ADS] [CrossRef] [Google Scholar]
- Balakrishnan, V., Champion, D., Barr, E., et al. 2021, MNRAS, 505, 1180 [NASA ADS] [CrossRef] [Google Scholar]
- Barsdell, B. R., Bailes, M., Barnes, D. G., & Fluke, C. J. 2012, MNRAS, 422, 379 [CrossRef] [Google Scholar]
- Bassa, C. G., Pleunis, Z., & Hessels, J. W. T. 2017a, Astron. Comput., 18, 40 [Google Scholar]
- Bassa, C. G., Pleunis, Z., Hessels, J. W. T., et al. 2017b, ApJ, 846, L20 [NASA ADS] [CrossRef] [Google Scholar]
- Bates, S. D., Lorimer, D. R., & Verbiest, J. P. W. 2013, MNRAS, 431, 1352 [Google Scholar]
- Bhattacharyya, B., Cooper, S., Malenta, M., et al. 2016, ApJ, 817, 130 [NASA ADS] [CrossRef] [Google Scholar]
- Bhattacharyya, B., Roy, J., Johnson, T. J., et al. 2021, ApJ, 910, 160 [NASA ADS] [CrossRef] [Google Scholar]
- Bilous, A. V., Kondratiev, V. I., Kramer, M., et al. 2016, A&A, 591, A134 [NASA ADS] [CrossRef] [EDP Sciences] [Google Scholar]
- Brentjens, M. A., & de Bruyn, A. G. 2005, A&A, 441, 1217 [NASA ADS] [CrossRef] [EDP Sciences] [Google Scholar]
- Broekema, P. C., Mol, J. J. D., Nijboer, R., et al. 2018, Astron. Comput., 23, 180 [NASA ADS] [CrossRef] [Google Scholar]
- Burn, B. J. 1966, MNRAS, 133, 67 [Google Scholar]
- Callingham, J. R., Vedantham, H. K., Shimwell, T. W., et al. 2021, Nat. Astron., 5, 1233 [NASA ADS] [CrossRef] [Google Scholar]
- Cameron, A. D., Champion, D. J., Kramer, M., et al. 2018, MNRAS, 475, L57 [NASA ADS] [CrossRef] [Google Scholar]
- Cameron, A. D., Li, D., Hobbs, G., et al. 2020, MNRAS, 495, 3515 [NASA ADS] [CrossRef] [Google Scholar]
- Camilo, F., Nice, D. J., Shrauner, J. A., & Taylor, J. H. 1996, ApJ, 469, 819 [Google Scholar]
- Camilo, F., Kerr, M., Ray, P. S., et al. 2015, ApJ, 810, 85 [NASA ADS] [CrossRef] [Google Scholar]
- Camilo, F., Ransom, S. M., Halpern, J. P., & Roshi, D. A. 2021, ApJ, 917, 67 [NASA ADS] [CrossRef] [Google Scholar]
- Chambers, K. C., Magnier, E. A., Metcalfe, N., et al. 2016, ArXiv e-prints [arXiv:1612.05560] [Google Scholar]
- Chen, H.-L., Chen, X., Tauris, T. M., & Han, Z. 2013, ApJ, 775, 27 [NASA ADS] [CrossRef] [Google Scholar]
- Clark, C., & Fermi-LAT Collaboration 2017, in Proceedings of the 7th International Fermi Symposium, 7 [Google Scholar]
- Coenen, T., van Leeuwen, J., Hessels, J. W. T., et al. 2014, A&A, 570, A60 [NASA ADS] [CrossRef] [EDP Sciences] [Google Scholar]
- Condon, J. J., Cotton, W. D., Greisen, E. W., et al. 1998, AJ, 115, 1693 [Google Scholar]
- Cordes, J. M., & Lazio, T. J. W. 2002, ArXiv e-prints [arXiv:astro-ph/0207156] [Google Scholar]
- Cordes, J. M., & Rickett, B. J. 1998, ApJ, 507, 846 [NASA ADS] [CrossRef] [Google Scholar]
- Cordes, J. M., Freire, P. C. C., Lorimer, D. R., et al. 2006, ApJ, 637, 446 [NASA ADS] [CrossRef] [Google Scholar]
- Crawford, F., Kaspi, V. M., & Bell, J. F. 2000, AJ, 119, 2376 [NASA ADS] [CrossRef] [Google Scholar]
- Crawford, F., Margeson, J., Nguyen, B., et al. 2021, Res. Am. Astron. Soc., 5, 21 [Google Scholar]
- Cutri, R. M., Skrutskie, M. F., van Dyk, S., et al. 2003, VizieR Online Data Catalog: II/246 [Google Scholar]
- Dai, S., Johnston, S., & Hobbs, G. 2017, MNRAS, 472, 1458 [NASA ADS] [CrossRef] [Google Scholar]
- Dai, S., Johnston, S., & Hobbs, G. 2018, in Pulsar Astrophysics the Next Fifty Years, eds. P. Weltevrede, B. B. P. Perera, L. L. Preston, & S. Sanidas, 337, 328 [NASA ADS] [Google Scholar]
- Dai, S., Johnston, S., Kerr, M., et al. 2020, ApJ, 888, L18 [NASA ADS] [CrossRef] [Google Scholar]
- de Gasperin, F., Intema, H. T., & Frail, D. A. 2018, MNRAS, 474, 5008 [Google Scholar]
- Deller, A. T., Goss, W. M., Brisken, W. F., et al. 2019, ApJ, 875, 100 [NASA ADS] [CrossRef] [Google Scholar]
- Demorest, P. B., Pennucci, T., Ransom, S. M., Roberts, M. S. E., & Hessels, J. W. T. 2010, Nature, 467, 1081 [Google Scholar]
- Deneva, J. S., Stovall, K., McLaughlin, M. A., et al. 2013, ApJ, 775, 51 [NASA ADS] [CrossRef] [Google Scholar]
- Edwards, R. T., Hobbs, G. B., & Manchester, R. N. 2006, MNRAS, 372, 1549 [Google Scholar]
- Erickson, W. 1980, Bull. Am. Astron. Soc., 12, 799 [Google Scholar]
- Everett, J. E., & Weisberg, J. M. 2001, ApJ, 553, 341 [NASA ADS] [CrossRef] [Google Scholar]
- Frail, D. A., Ray, P. S., Mooley, K. P., et al. 2018, MNRAS, 475, 942 [NASA ADS] [CrossRef] [Google Scholar]
- Gaia Collaboration (Brown, A. G. A., et al.) 2016, A&A, 595, A2 [NASA ADS] [CrossRef] [EDP Sciences] [Google Scholar]
- Gaia Collaboration (Brown, A. G. A., et al.) 2018, A&A, 616, A1 [NASA ADS] [CrossRef] [EDP Sciences] [Google Scholar]
- Galvin, T. J., Huynh, M. T., Norris, R. P., et al. 2020, MNRAS, 497, 2730 [NASA ADS] [CrossRef] [Google Scholar]
- Geyer, M., Karastergiou, A., Kondratiev, V. I., et al. 2017, MNRAS, 470, 2659 [NASA ADS] [CrossRef] [Google Scholar]
- Good, D. C., Andersen, B. C., Chawla, P., et al. 2021, ApJ, 922, 43 [NASA ADS] [CrossRef] [Google Scholar]
- Gould, D. M., & Lyne, A. G. 1998, MNRAS, 301, 235 [NASA ADS] [CrossRef] [Google Scholar]
- Hamilton, T. T., Helfand, D. J., & Becker, R. H. 1985, AJ, 90, 606 [NASA ADS] [CrossRef] [Google Scholar]
- Han, J. L., Wang, C., Wang, P. F., et al. 2021, Res. Astron. Astrophys., 21, 107 [CrossRef] [Google Scholar]
- Hankins, T. H., & Rickett, B. J. 1975, Methods. Comput. Phys., 14, 55 [NASA ADS] [Google Scholar]
- Harris, C. R., Millman, K. J., van der Walt, S. J., et al. 2020, Nature, 585, 357 [NASA ADS] [CrossRef] [Google Scholar]
- Heald, G., Braun, R., & Edmonds, R. 2009, A&A, 503, 409 [NASA ADS] [CrossRef] [EDP Sciences] [Google Scholar]
- Heald, G., Mao, S., Vacca, V., et al. 2020, Galaxies, 8, 53 [Google Scholar]
- Helfand, D. J., White, R. L., & Becker, R. H. 2015, ApJ, 801, 26 [NASA ADS] [CrossRef] [Google Scholar]
- Hernández-Pajares, M., Juan, J. M., Sanz, J., et al. 2009, J. Geod., 83, 263 [CrossRef] [Google Scholar]
- Herrera Ruiz, N., O’Sullivan, S. P., Vacca, V., et al. 2021, A&A, 648, A12 [EDP Sciences] [Google Scholar]
- Hessels, J. W. T., Ransom, S. M., Stairs, I. H., et al. 2006, Science, 311, 1901 [CrossRef] [PubMed] [Google Scholar]
- Hessels, J. W. T., Ransom, S. M., Stairs, I. H., Kaspi, V. M., & Freire, P. C. C. 2007, ApJ, 670, 363 [NASA ADS] [CrossRef] [Google Scholar]
- Hessels, J., Possenti, A., Bailes, M., et al. 2015, in Advancing Astrophysics with the Square Kilometre Array AASKA14, 47 [Google Scholar]
- Hobbs, G. B., Edwards, R. T., & Manchester, R. N. 2006, MNRAS, 369, 655 [Google Scholar]
- Hotan, A. W., van Straten, W., & Manchester, R. N. 2004, PASA, 21, 302 [Google Scholar]
- Hunter, J. D. 2007, Comput. Sci. Eng., 9, 90 [NASA ADS] [CrossRef] [Google Scholar]
- Hutschenreuter, S., Anderson, C. S., Betti, S., et al. 2022, A&A, 657, A43 [NASA ADS] [CrossRef] [EDP Sciences] [Google Scholar]
- Hyman, S. D., Frail, D. A., Deneva, J. S., et al. 2019, ApJ, 876, 20 [NASA ADS] [CrossRef] [Google Scholar]
- Hyman, S. D., Frail, D. A., Deneva, J. S., et al. 2021, MNRAS, 507, 3888 [NASA ADS] [CrossRef] [Google Scholar]
- Jankowski, F., van Straten, W., Keane, E. F., et al. 2018, MNRAS, 473, 4436 [Google Scholar]
- Jelić, V., de Bruyn, A. G., Pandey, V. N., et al. 2015, A&A, 583, A137 [Google Scholar]
- Johnston, S., & Lower, M. E. 2021, MNRAS, 507, L41 [NASA ADS] [CrossRef] [Google Scholar]
- Johnston, S., Karastergiou, A., Mitra, D., & Gupta, Y. 2008, MNRAS, 388, 261 [NASA ADS] [CrossRef] [Google Scholar]
- Kaplan, D. L., Condon, J. J., Arzoumanian, Z., & Cordes, J. M. 1998, ApJS, 119, 75 [NASA ADS] [CrossRef] [Google Scholar]
- Kaplan, D. L., Dai, S., Lenc, E., et al. 2019, ApJ, 884, 96 [NASA ADS] [CrossRef] [Google Scholar]
- Kaspi, V. M. 2018, in Pulsar Astrophysics the Next Fifty Years, eds. P. Weltevrede, B. B. P. Perera, L. L. Preston, & S. Sanidas, 337, 3 [NASA ADS] [Google Scholar]
- Keane, E., Bhattacharyya, B., Kramer, M., et al. 2015, in Advancing Astrophysics with the Square Kilometre Array (AASKA14), 40 [Google Scholar]
- Keane, E. F., Barr, E. D., Jameson, A., et al. 2018, MNRAS, 473, 116 [NASA ADS] [CrossRef] [Google Scholar]
- Keith, M. J., Jameson, A., van Straten, W., et al. 2010, MNRAS, 409, 619 [Google Scholar]
- Kondratiev, V. I., Verbiest, J. P. W., Hessels, J. W. T., et al. 2016, A&A, 585, A128 [NASA ADS] [CrossRef] [EDP Sciences] [Google Scholar]
- Kramer, M., Xilouris, K. M., Lorimer, D. R., et al. 1998, ApJ, 501, 270 [Google Scholar]
- Kulkarni, S. R., Clifton, T. C., Backer, D. C., Foster, R. S., & Fruchter, A. S. 1988, Nature, 331, 50 [NASA ADS] [CrossRef] [Google Scholar]
- Kumamoto, H., Dai, S., Johnston, S., et al. 2021, MNRAS, 501, 4490 [NASA ADS] [CrossRef] [Google Scholar]
- Lenc, E., Anderson, C. S., Barry, N., et al. 2017, PASA, 34, e040 [Google Scholar]
- Levin, L., Armour, W., Baffa, C., et al. 2018, in Pulsar Astrophysics the Next Fifty Years, eds. P. Weltevrede, B. B. P. Perera, L L. Preston, & S. Sanidas, 337, 171 [NASA ADS] [Google Scholar]
- Lonsdale, C. J., Smith, H. E., Rowan-Robinson, M., et al. 2003, PASP, 115, 897 [Google Scholar]
- Lorimer, D. R., & Kramer, M. 2004, Handbook of Pulsar Astronomy (Cambridge: Cambridge University Press) [Google Scholar]
- Lorimer, D. R., Faulkner, A. J., Lyne, A. G., et al. 2006, MNRAS, 372, 777 [NASA ADS] [CrossRef] [Google Scholar]
- Lyne, A. G., Brinklow, A., Middleditch, J., Kulkarni, S. R., & Backer, D. C. 1987, Nature, 328, 399 [NASA ADS] [CrossRef] [Google Scholar]
- Lyon, R. J., Stappers, B. W., Cooper, S., Brooke, J. M., & Knowles, J. D. 2016, MNRAS, 459, 1104 [NASA ADS] [CrossRef] [Google Scholar]
- Maan, Y., Bassa, C., van Leeuwen, J., Krishnakumar, M. A., & Joshi, B. C. 2018, ApJ, 864, 16 [NASA ADS] [CrossRef] [Google Scholar]
- Macquart, J. P., & Fender, R. P. 2004, Circular Polarisation from Relativistic Jet Sources, 288 [Google Scholar]
- Magro, A., Karastergiou, A., Salvini, S., et al. 2011, MNRAS, 417, 2642 [NASA ADS] [CrossRef] [Google Scholar]
- Manchester, R. N., Lyne, A. G., Camilo, F., et al. 2001, MNRAS, 328, 17 [NASA ADS] [CrossRef] [Google Scholar]
- Manchester, R. N., Hobbs, G. B., Teoh, A., & Hobbs, M. 2005, AJ, 129, 1993 [Google Scholar]
- Melrose, D. B., & Luo, Q. 2004, MNRAS, 352, 915 [NASA ADS] [CrossRef] [Google Scholar]
- Michilli, D., Bassa, C., Cooper, S., et al. 2020, MNRAS, 491, 725 [Google Scholar]
- Mitra, D., Wielebinski, R., Kramer, M., & Jessner, A. 2003, A&A, 398, 993 [NASA ADS] [CrossRef] [EDP Sciences] [Google Scholar]
- Morello, V., Barr, E. D., Stappers, B. W., Keane, E. F., & Lyne, A. G. 2020, MNRAS, 497, 4654 [NASA ADS] [CrossRef] [Google Scholar]
- Mostert, R. I. J., Duncan, K. J., Röttgering, H. J. A., et al. 2021, A&A, 645, A89 [NASA ADS] [CrossRef] [EDP Sciences] [Google Scholar]
- Navarro, J., de Bruyn, A. G., Frail, D. A., Kulkarni, S. R., & Lyne, A. G. 1995, ApJ, 455, L55 [NASA ADS] [Google Scholar]
- Ng, C., Pandhi, A., Naidu, A., et al. 2020, MNRAS, 496, 2836 [NASA ADS] [CrossRef] [Google Scholar]
- Noll, C. E. 2010, AdSpR, 45, 1421 [NASA ADS] [Google Scholar]
- Noutsos, A., Sobey, C., Kondratiev, V. I., et al. 2015, A&A, 576, A62 [NASA ADS] [CrossRef] [EDP Sciences] [Google Scholar]
- O’Sullivan, S. P., McClure-Griffiths, N. M., Feain, I. J., Gaensler, B. M., & Sault, R. J. 2013, MNRAS, 435, 311 [CrossRef] [Google Scholar]
- O’Sullivan, S. P., Brüggen, M., Vazza, F., et al. 2020, MNRAS, 495, 2607 [Google Scholar]
- Oswald, L. S., Karastergiou, A., Posselt, B., et al. 2021, MNRAS, 504, 1115 [NASA ADS] [CrossRef] [Google Scholar]
- Pan, Z., Qian, L., Ma, X., et al. 2021, ApJ, 915, L28 [NASA ADS] [CrossRef] [Google Scholar]
- Parthasarathy, A., Shannon, R. M., Johnston, S., et al. 2019, MNRAS, 489, 3810 [Google Scholar]
- Perera, B. B. P., DeCesar, M. E., Demorest, P. B., et al. 2019, MNRAS, 490, 4666 [Google Scholar]
- Pilia, M., Hessels, J. W. T., Stappers, B. W., et al. 2016, A&A, 586, A92 [NASA ADS] [CrossRef] [EDP Sciences] [Google Scholar]
- Pleunis, Z., Bassa, C. G., Hessels, J. W. T., et al. 2017, ApJ, 846, L19 [Google Scholar]
- Polzin, E. J., Breton, R. P., Bhattacharyya, B., et al. 2020, MNRAS, 494, 2948 [Google Scholar]
- Pritchard, J., Murphy, T., Zic, A., et al. 2021, MNRAS, 502, 5438 [NASA ADS] [CrossRef] [Google Scholar]
- Radhakrishnan, V., & Cooke, D. J. 1969, Astrophys. Lett., 3, 225 [NASA ADS] [Google Scholar]
- Rajwade, K., Chennamangalam, J., Lorimer, D., & Karastergiou, A. 2018, MNRAS, 479, 3094 [Google Scholar]
- Ransom, S. M. 2001, PhD Thesis, Harvard University, USA [Google Scholar]
- Ransom, S. M. 2008, in 40 Years of Pulsars: Millisecond Pulsars, Magnetars and More, eds. C. Bassa, Z. Wang, A. Cumming, & V. M. Kaspi, AIP Conf. Ser., 983, 415 [NASA ADS] [CrossRef] [Google Scholar]
- Ransom, S. M., Eikenberry, S. S., & Middleditch, J. 2002, AJ, 124, 1788 [Google Scholar]
- Ransom, S. M., Hessels, J. W. T., Stairs, I. H., et al. 2005, Science, 307, 892 [NASA ADS] [CrossRef] [PubMed] [Google Scholar]
- Ransom, S. M., Stairs, I. H., Archibald, A. M., et al. 2014, Nature, 505, 520 [NASA ADS] [CrossRef] [Google Scholar]
- Ravi, K., & Deshpande, A. A. 2018, ApJ, 859, 22 [NASA ADS] [CrossRef] [Google Scholar]
- Ridolfi, A., Gautam, T., Freire, P. C. C., et al. 2021, MNRAS, 504, 1407 [NASA ADS] [CrossRef] [Google Scholar]
- Riley, T. E., Watts, A. L., Ray, P. S., et al. 2021, ApJ, 918, L27 [CrossRef] [Google Scholar]
- Riseley, C. J., Galvin, T. J., Sobey, C., et al. 2020, PASA, 37, e029 [Google Scholar]
- Sanidas, S., Caleb, M., Driessen, L., et al. 2018, in Pulsar Astrophysics the Next Fifty Years, eds. P. Weltevrede, B. B. P. Perera, L. L. Preston, & S. Sanidas, 337, 406 [NASA ADS] [Google Scholar]
- Sanidas, S., Cooper, S., Bassa, C. G., et al. 2019, A&A, 626, A104 [NASA ADS] [CrossRef] [EDP Sciences] [Google Scholar]
- Sanpa-arsa, S. 2016, PhD Thesis, University of Virginia, USA [Google Scholar]
- Saz Parkinson, P. M., Xu, H., Yu, P. L. H., et al. 2016, ApJ, 820, 8 [NASA ADS] [CrossRef] [Google Scholar]
- Schinzel, F. K., Kerr, M., Rau, U., Bhatnagar, S., & Frail, D. A. 2019, ApJ, 876, L17 [Google Scholar]
- Sclocco, A., Heldens, S., & van Werkhoven, B. 2020, SoftwareX, 12, 100549 [NASA ADS] [CrossRef] [Google Scholar]
- Shimwell, T. W., Röttgering, H. J. A., Best, P. N., et al. 2017, A&A, 598, A104 [NASA ADS] [CrossRef] [EDP Sciences] [Google Scholar]
- Shimwell, T. W., Tasse, C., Hardcastle, M. J., et al. 2019, A&A, 622, A1 [NASA ADS] [CrossRef] [EDP Sciences] [Google Scholar]
- Shimwell, T. W., Hardcastle, M. J., Tasse, C., et al. 2022, A&A, 659, A1 [NASA ADS] [CrossRef] [EDP Sciences] [Google Scholar]
- Sobey, C., Bilous, A. V., Grießmeier, J. M., et al. 2019, MNRAS, 484, 3646 [Google Scholar]
- Sobey, C., Johnston, S., Dai, S., et al. 2021, MNRAS, 504, 228 [NASA ADS] [CrossRef] [Google Scholar]
- Sotomayor-Beltran, C., Sobey, C., Hessels, J. W. T., et al. 2013, A&A, 552, A58 [NASA ADS] [CrossRef] [EDP Sciences] [Google Scholar]
- Stappers, B. W., Hessels, J. W. T., Alexov, A., et al. 2011, A&A, 530, A80 [NASA ADS] [CrossRef] [EDP Sciences] [Google Scholar]
- Stovall, K., Lynch, R. S., Ransom, S. M., et al. 2014, ApJ, 791, 67 [CrossRef] [Google Scholar]
- Strom, R. G. 1987, ApJ, 319, L103 [NASA ADS] [CrossRef] [Google Scholar]
- Swainston, N. A., Bhat, N. D. R., Sokolowski, M., et al. 2021, ApJ, 911, L26 [NASA ADS] [CrossRef] [Google Scholar]
- Tan, C. M., Bassa, C. G., Cooper, S., et al. 2018a, ApJ, 866, 54 [NASA ADS] [CrossRef] [Google Scholar]
- Tan, C. M., Lyon, R. J., Stappers, B. W., et al. 2018b, MNRAS, 474, 4571 [NASA ADS] [CrossRef] [Google Scholar]
- Tan, C. M., Bassa, C. G., Cooper, S., et al. 2020, MNRAS, 492, 5878 [NASA ADS] [CrossRef] [Google Scholar]
- Tasse, C., Shimwell, T., Hardcastle, M. J., et al. 2021, A&A, 648, A1 [EDP Sciences] [Google Scholar]
- Tauris, T. M. 2012, Science, 335, 561 [NASA ADS] [CrossRef] [Google Scholar]
- Terral, P., & Ferrière, K. 2017, A&A, 600, A29 [NASA ADS] [CrossRef] [EDP Sciences] [Google Scholar]
- Thébault, E., Finlay, C. C., Beggan, C. D., et al. 2015, Earth Planets Space, 67, 79 [Google Scholar]
- Tyul’bashev, S. A., Tyul’bashev, V. S., Oreshko, V. V., & Logvinenko, S. V. 2016, Astron. Rep., 60, 220 [CrossRef] [Google Scholar]
- van Haarlem, M. P., Wise, M. W., Gunst, A. W., et al. 2013, A&A, 556, A2 [NASA ADS] [CrossRef] [EDP Sciences] [Google Scholar]
- van Straten, W., & Bailes, M. 2011, PASA, 28, 1 [Google Scholar]
- Vedantham, H. K., Callingham, J. R., Shimwell, T. W., et al. 2020, ApJ, 903, L33 [Google Scholar]
- Venkatraman Krishnan, V., Flynn, C., Farah, W., et al. 2020, MNRAS, 492, 4752 [NASA ADS] [CrossRef] [Google Scholar]
- Wang, N., Manchester, R. N., & Johnston, S. 2007, MNRAS, 377, 1383 [Google Scholar]
- Wijnands, R., & van der Klis, M. 1998, Nature, 394, 344 [CrossRef] [Google Scholar]
- Wright, E. L., Eisenhardt, P. R. M., Mainzer, A. K., et al. 2010, AJ, 140, 1868 [Google Scholar]
- Xue, M., Bhat, N. D. R., Tremblay, S. E., et al. 2017, PASA, 34, e070 [NASA ADS] [CrossRef] [Google Scholar]
- Xue, M., Ord, S. M., Tremblay, S. E., et al. 2019, PASA, 36, e025 [NASA ADS] [CrossRef] [Google Scholar]
- Yao, J. M., Manchester, R. N., & Wang, N. 2017, ApJ, 835, 29 [NASA ADS] [CrossRef] [Google Scholar]
All Tables
LoTSS sources selected as pulsar candidates based on their polarisation properties.
Pulsars discovered or independently re-discovered (detected) in the TULIPP survey.
All Figures
|
Fig. 1. Fractional polarisation against total intensity (Stokes I) flux density for: LoTSS sources (black points); pulsars discovered or detected through the TULIPP survey (squares); candidates observed and searched for pulsars in this work (blue circles); and known pulsars (red circles). Left: linearly polarised sources from the RM GRID (O’Sullivan et al., in prep.). Right: circularly polarised sources (absolute values) from V-LoTSS (Callingham et al., in prep.). |
| In the text | |
|
Fig. 2. Properties of ILT J104937.86+582217.6/PSR J1049+5822 discovered in the TULIPP survey, where the panels show the following (top to bottom). (1) LoTSS image at a centre frequency of 144 MHz with a 20″ resolution, contours show the total intensity starting at 0.5 mJy beam−1 and increase by factors of 2, and colours show fractional linear polarisation with peak of 63.5%; the beam size is shown at the lower left corner. The extension to the north is due to another unrelated radio source in LoTSS. (2) Faraday spectrum (original – grey dashed line; RM CLEANed – blue line) computed from RM GRID processing of the LoTSS polarisation image data. The red cross shows the peak corresponding to the RM = 4.11 rad m−2. (3) Folded polarisation pulse profile, showing the normalised flux density (arbitrary units) for total intensity (Stokes I, black line), linear polarisation (L, red dashed line), and circular polarisation (V, blue dotted line), and the polarisation position angle (arbitrary average offset from 0°). (4) Faraday spectrum (original – grey line; RM CLEANed – black line) computed using PSR J1049+5822 pulsar observations. The grey dashed line shows the RM CLEAN component at 4.732 ± 0.016 rad m−2, prior to the ionospheric RM correction. |
| In the text | |
|
Fig. 3. Pulsar timing residuals from the timing models in Table 3 for PSR J1049+5822 (a) and PSR J1630+3550 (b) as a function of time, and PSR J1630+3550 as a function of orbital phase (c). |
| In the text | |
|
Fig. 4. Properties of ILT J160218.82+390101.5/PSR J1602+3901 discovered in the TULIPP survey. The top panel shows LoTSS image at a centre frequency of 144 MHz with a 20″ resolution, where contours show total intensity starting at 0.5 mJy beam−1 and increase by factors of 2, and colours show fractional circular polarisation with peak of 9%. The beam size is shown in the lower left corner. The bottom panel shows the polarisation pulse profile. The normalised flux density (arbitrary units) is shown for total intensity (Stokes I, black line), linear polarisation (L, red dashed line), and circular polarisation (V, blue dotted line). Polarisation position angles are not shown, because no linear polarisation was detected above 3× the rms of the off-pulse baseline. |
| In the text | |
|
Fig. 5. Properties of ILT J163035.93+355042.5/PSR J1630+3550, where the panels show the following (top to bottom). (1) LoTSS image at a centre frequency of 144 MHz with a 20″ resolution, contours show total intensity starting at 0.5 mJy beam−1 and increase by factors of 2, and colours show fractional linear polarisation with a peak of 32%. The beam size is shown at the lower left corner. (2) Faraday spectrum (original – grey dashed line; RM CLEANed – blue line) computed from RM GRID processing using the LoTSS polarisation image data. The red cross shows the peak at 8.65 rad m−2. (3) Folded polarisation pulse profile from a 20-min observation at 149 MHz with 78 MHz bandwidth and 512 pulse profile bins. Lower panel: normalised flux density (arbitrary units) for total intensity (Stokes I, black line), linear polarisation (L, red dashed line), and circular polarisation (Stokes V, blue dotted line). Upper panel: polarisation position angle (arbitrary average offset from 0 deg). (4) Faraday spectrum (original – grey line; RM CLEANed – black line) computed using PSR J1630+3550 pulsar data. The grey dashed line shows the RM CLEAN component at 9.486 ± 0.025 rad m−2, prior to the ionospheric RM subtraction. |
| In the text | |
|
Fig. 6. Polarisation pulse profiles for known PSRs J0220+3626 (upper), J0742+4110 (middle), and J2212+2450 (lower), respectively, detected in the TULIPP survey. Each was obtained using 20-min observations at a centre frequency of 149 MHz with a 78 MHz bandwidth, and 256, 128, and 128 pulse profile bins, respectively. The normalised flux density (arbitrary units) is shown for total intensity (Stokes I, black lines), linear polarisation (L, red dashed lines), and circular polarisation (Stokes V, blue dotted lines). Polarisation position angles are not shown, because no linear polarisation was detected above 3 × rms of the off-pulse baseline. |
| In the text | |
|
Fig. 7. Properties of the known PSR J2227+3038 detected in the TULIPP survey. Upper: polarisation pulse profile obtained from a 20-min observation at a centre frequency of 149 MHz with a 78 MHz bandwidth and 1024 pulse profile bins, showing the normalised flux density (arbitrary units) for total intensity (Stokes I, black line), linear polarisation (L, red dashed line), circular polarisation (Stokes V, blue dotted line), and polarisation position angle (arbitrary average offset from 0 deg). Lower: faraday spectrum (original – grey line; RM CLEANed – black line) computed using PSR J2227+3038 pulsar data. The grey dashed line shows the RM CLEAN component at −59.04 ± 0.03 rad m−2, prior to the ionospheric RM subtraction. |
| In the text | |
Current usage metrics show cumulative count of Article Views (full-text article views including HTML views, PDF and ePub downloads, according to the available data) and Abstracts Views on Vision4Press platform.
Data correspond to usage on the plateform after 2015. The current usage metrics is available 48-96 hours after online publication and is updated daily on week days.
Initial download of the metrics may take a while.