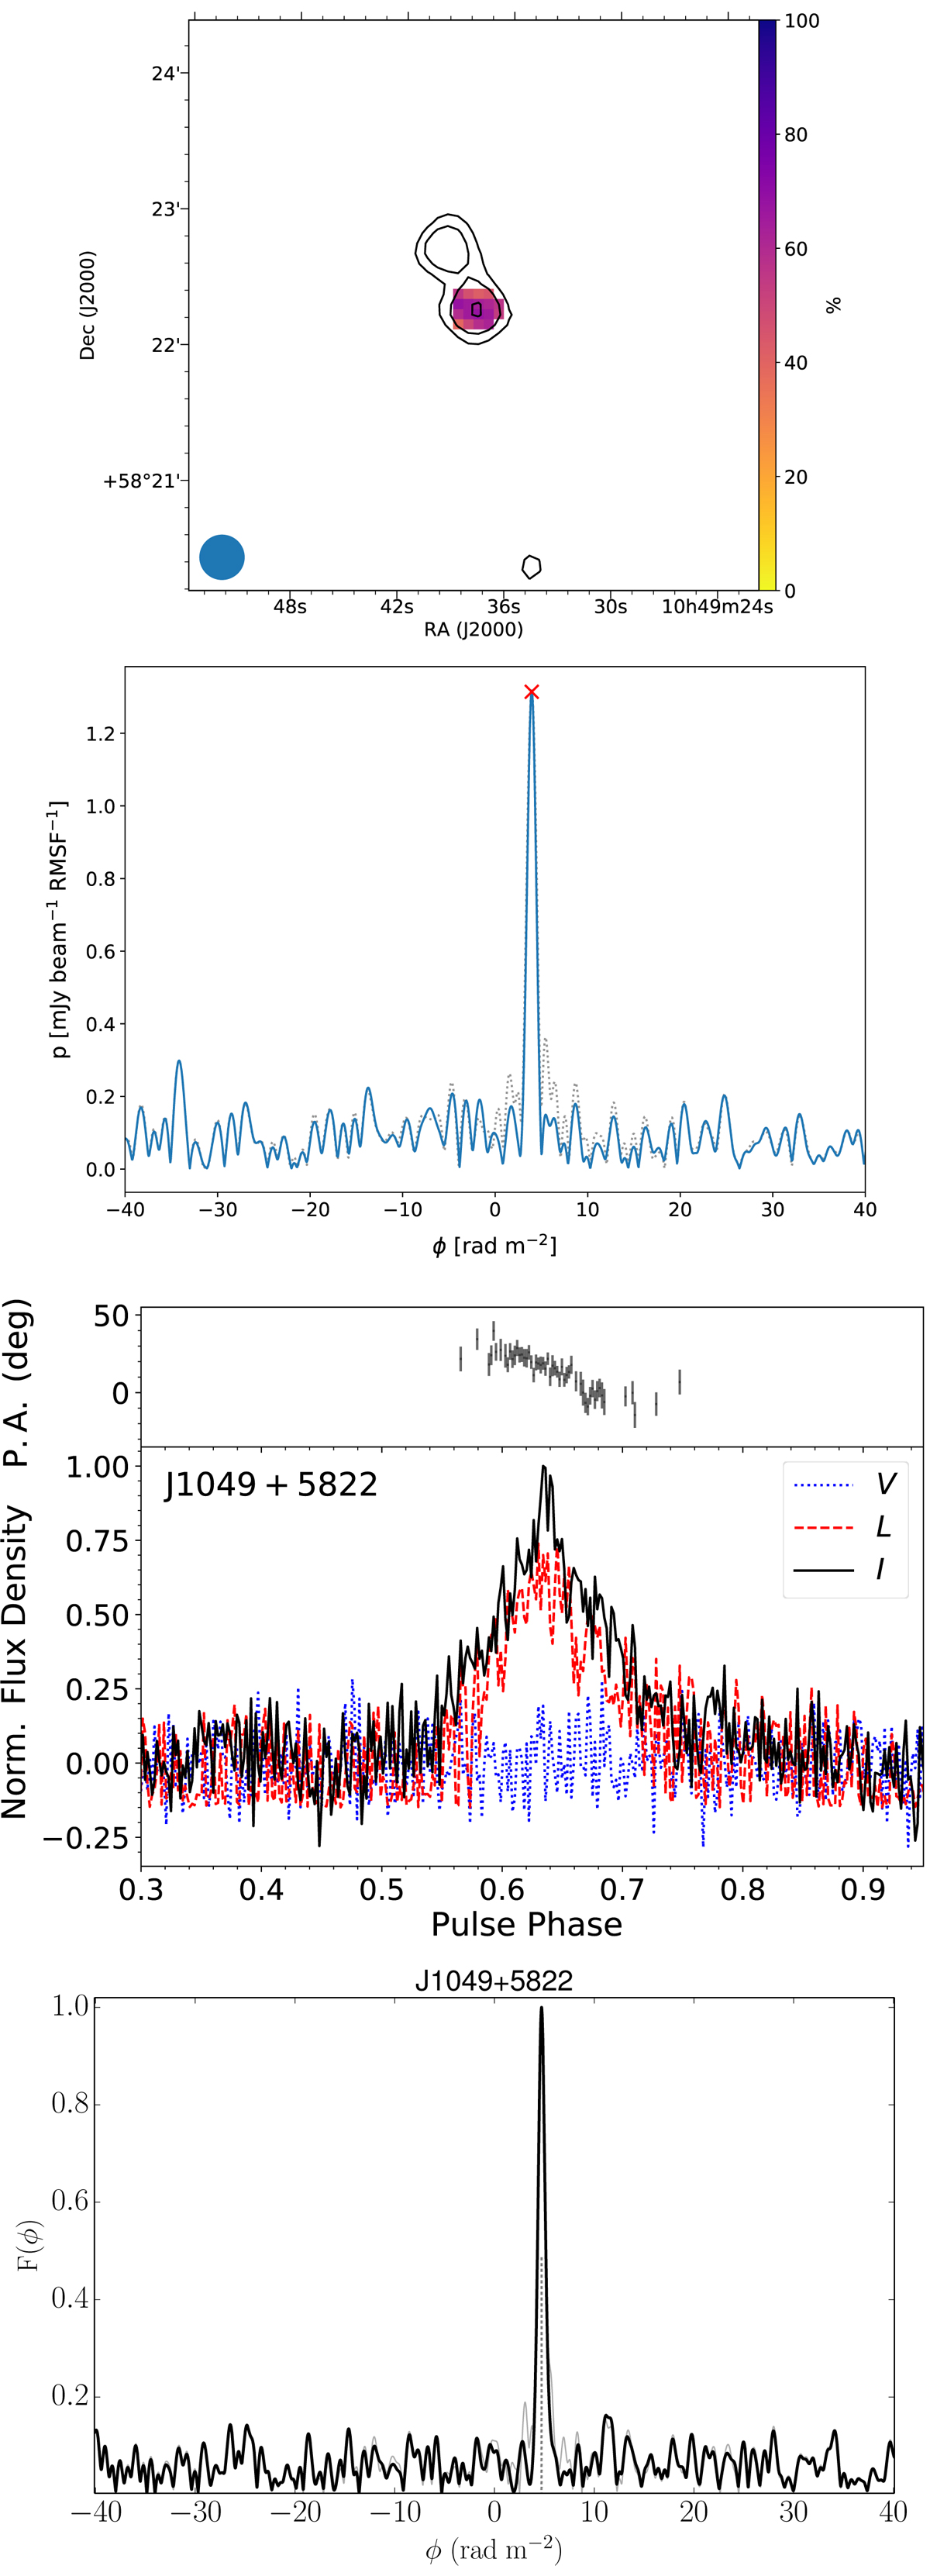
Fig. 2.
Download original image
Properties of ILT J104937.86+582217.6/PSR J1049+5822 discovered in the TULIPP survey, where the panels show the following (top to bottom). (1) LoTSS image at a centre frequency of 144 MHz with a 20″ resolution, contours show the total intensity starting at 0.5 mJy beam−1 and increase by factors of 2, and colours show fractional linear polarisation with peak of 63.5%; the beam size is shown at the lower left corner. The extension to the north is due to another unrelated radio source in LoTSS. (2) Faraday spectrum (original – grey dashed line; RM CLEANed – blue line) computed from RM GRID processing of the LoTSS polarisation image data. The red cross shows the peak corresponding to the RM = 4.11 rad m−2. (3) Folded polarisation pulse profile, showing the normalised flux density (arbitrary units) for total intensity (Stokes I, black line), linear polarisation (L, red dashed line), and circular polarisation (V, blue dotted line), and the polarisation position angle (arbitrary average offset from 0°). (4) Faraday spectrum (original – grey line; RM CLEANed – black line) computed using PSR J1049+5822 pulsar observations. The grey dashed line shows the RM CLEAN component at 4.732 ± 0.016 rad m−2, prior to the ionospheric RM correction.
Current usage metrics show cumulative count of Article Views (full-text article views including HTML views, PDF and ePub downloads, according to the available data) and Abstracts Views on Vision4Press platform.
Data correspond to usage on the plateform after 2015. The current usage metrics is available 48-96 hours after online publication and is updated daily on week days.
Initial download of the metrics may take a while.