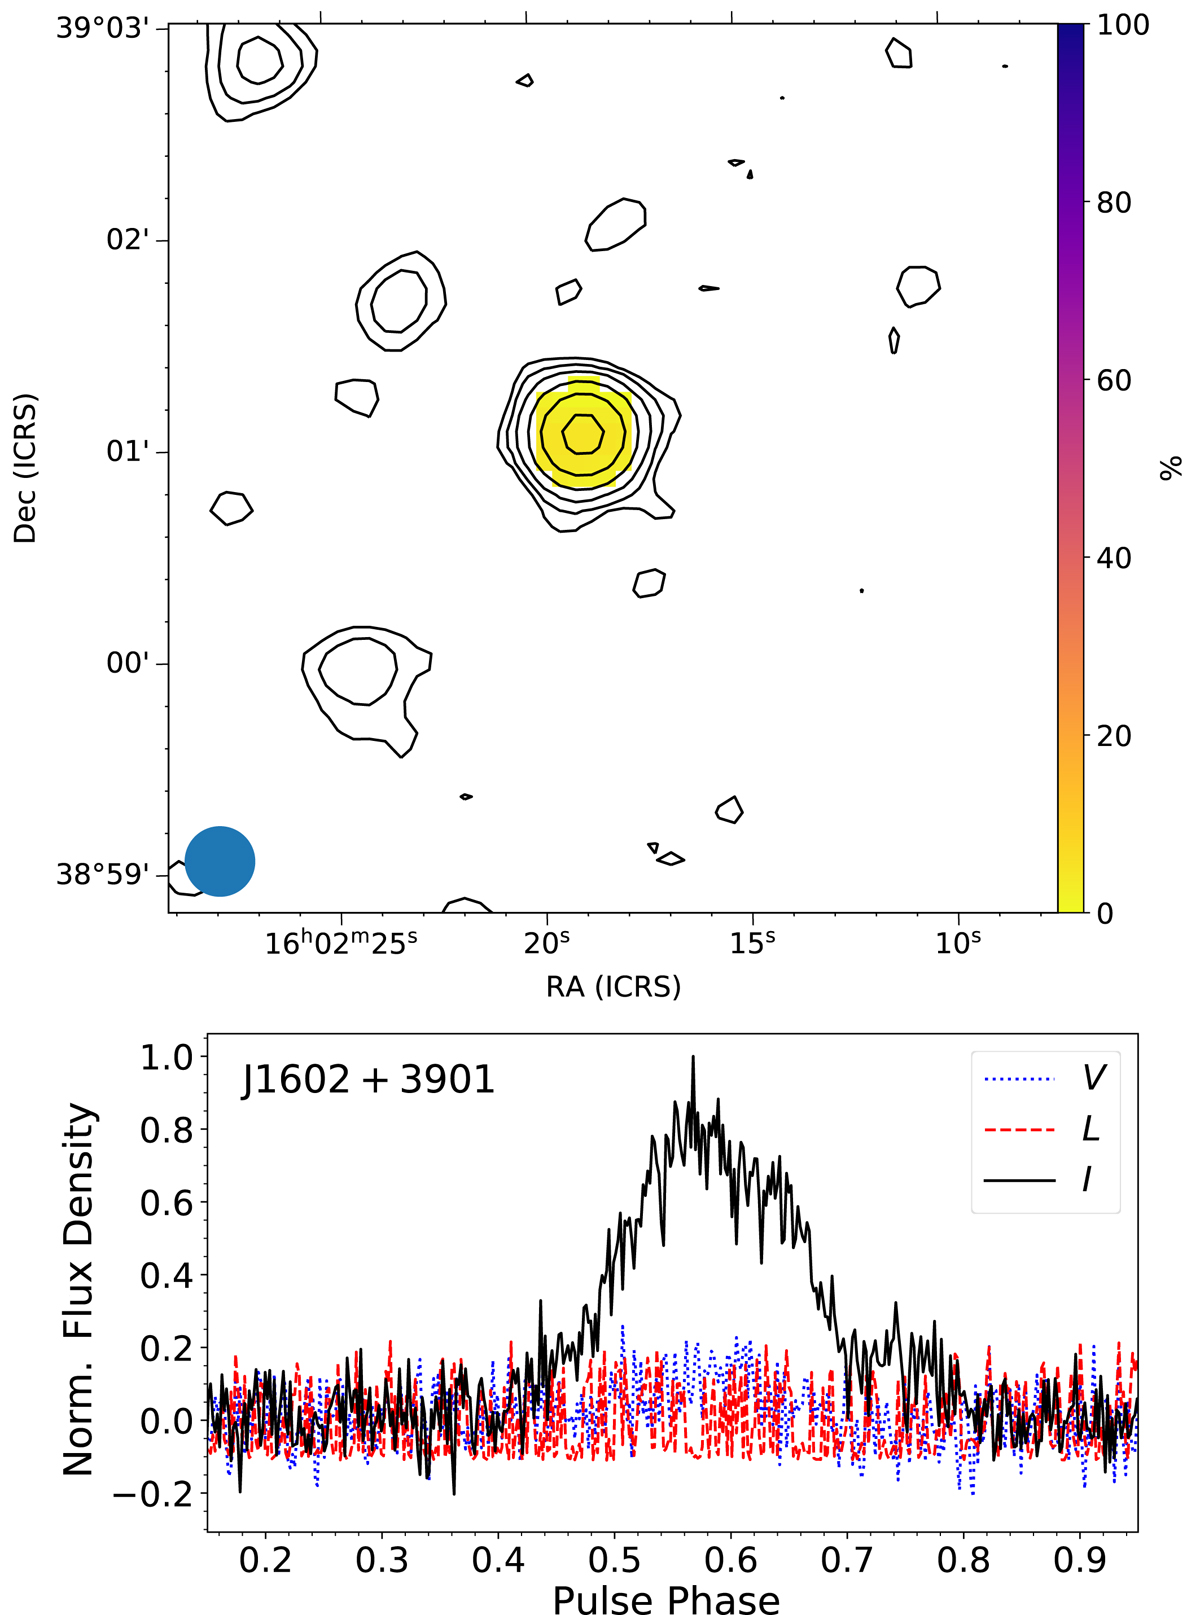
Fig. 4.
Download original image
Properties of ILT J160218.82+390101.5/PSR J1602+3901 discovered in the TULIPP survey. The top panel shows LoTSS image at a centre frequency of 144 MHz with a 20″ resolution, where contours show total intensity starting at 0.5 mJy beam−1 and increase by factors of 2, and colours show fractional circular polarisation with peak of 9%. The beam size is shown in the lower left corner. The bottom panel shows the polarisation pulse profile. The normalised flux density (arbitrary units) is shown for total intensity (Stokes I, black line), linear polarisation (L, red dashed line), and circular polarisation (V, blue dotted line). Polarisation position angles are not shown, because no linear polarisation was detected above 3× the rms of the off-pulse baseline.
Current usage metrics show cumulative count of Article Views (full-text article views including HTML views, PDF and ePub downloads, according to the available data) and Abstracts Views on Vision4Press platform.
Data correspond to usage on the plateform after 2015. The current usage metrics is available 48-96 hours after online publication and is updated daily on week days.
Initial download of the metrics may take a while.