| Issue |
A&A
Volume 661, May 2022
The Early Data Release of eROSITA and Mikhail Pavlinsky ART-XC on the SRG mission
|
|
|---|---|---|
| Article Number | A40 | |
| Number of page(s) | 16 | |
| Section | Galactic structure, stellar clusters and populations | |
| DOI | https://doi.org/10.1051/0004-6361/202141132 | |
| Published online | 18 May 2022 | |
X-raying the Sco-Cen OB association: The low-mass stellar population revealed by eROSITA★
Hamburger Sternwarte, Universität Hamburg,
Gojenbergsweg 112,
21029
Hamburg,
Germany
e-mail: This email address is being protected from spambots. You need JavaScript enabled to view it.
Received:
19
April
2021
Accepted:
19
June
2021
Abstract
We present the results of the first X-ray all-sky survey (eRASS1) performed by the eROSITA instrument on board the Spectrum-Roentgen-Gamma observatory of the Sco-Cen OB association. Bona fide Sco-Cen member stars are young and are therefore expected to emit X-rays at the saturation level. The sensitivity limit of eRASS1 makes these stars detectable down to about a tenth of a solar mass. By cross-correlating the eRASS1 source catalog with the Gaia EDR3 catalog, we arrive at a complete identification of the stellar (i.e., coronal) source content of eROSITA in the Sco-Cen association, and in particular obtain for the first time a 3D view of the detected stellar X-ray sources. Focusing on the low-mass population and placing the optical counterparts identified in this way in a color-magnitude diagram, we can isolate the young stars out of the detected X-ray sources and obtain age estimates of the various Sco-Cen populations. A joint analysis of the 2D and 3D space motions, the latter being available only for a smaller subset of the detected stellar X-ray sources, reveals that the space motions of the selected population show a high degree of parallelism, but there is also an additional population of young, X-ray emitting and essentially cospatial stars that appears to be more diffuse in velocity space. Its nature is currently unclear. We argue that with our procedures, an identification of almost the whole stellar content of the Sco-Cen association will become possible once the final Gaia and eROSITA catalogs are available by the end of this decade. We furthermore call into question any source population classification scheme that relies on purely kinematic selection criteria.
Key words: stars: activity / stars: coronae / stars: low-mass / X-rays: stars
Full Table A.1 is only available at the CDS via anonymous ftp to cdsarc.u-strasbg.fr (130.79.128.5) or via http://cdsarc.u-strasbg.fr/viz-bin/cat/J/A+A/661/A40
© ESO 2022
1 Introduction
Stars are born not in isolation, but in large groups or associations. The Sco-Cen OB association is the association nearest to the Sun and can therefore be studied in great detail. Many and maybe all of the Milky Way stars were born in associations like this (cf. Bressert et al. 2010). A detailed understanding of star formation in Sco-Cen is therefore of substantial relevance to our understanding of star formation in general. The Sco-Cen association is huge, extending over the almost entire fourth galactic quadrant from the constellations Crux and Carina over Lupus and Centaurus to Scorpius. Preibisch & Mamajek (2008) provided an extensive and excellent overview covering the vast body of research on the Sco-Cen star-forming region.
The Sco-Cen OB association consists of approximately 150 B-type stars spread over about 80 degrees in galactic longitude (cf. Fig. 9 in de Zeeuw et al. 1999), and it is therefore not highly conspicuous on the sky. Kapteyn (1914) realized the parallelism of the tangential motions of these stars, but the reality of Sco-Cen OB as a physical entity remained controversial until Blaauw (1946) convincingly demonstrated that Sco-Cen OB is indeed a true moving group. Blaauw (1946) also introduced the subdivision of Sco-Cen OB into three groups, known today as Lower-Centaurus-Crux (LCC), Upper-Centaurus-Lupus (UCL), and Upper Scorpius (US) in increasing galactic longitude. We also use these groups here, although this subdivision is to some extent arbitrary.
The definitive study of the Sco-Cen association based on HIPPARCOS data was presented by de Zeeuw et al. (1999), who reported (cf. their Table 2) 97, 134, and 83 early-type stars in LCC, UCL, and US, respectively. All of the stars identified by de Zeeuw et al. (1999) are of spectral type B (or later), none are of spectral type O. Hoogerwerf et al. (2001) argued that the runaway star ζ Oph (spectral type O9.5V) originated in Sco-Cen and was expelled in the supernova explosion that gave rise to the pulsar PSR J1932+1059. If this interpretation is correct, ζ Oph would be the last survivor of the O-star population of Sco-Cen. The three Sco-Cen subgroups are known to have different ages. US clearly is the youngest subgroup, and the UCL and LCC complexes are older. The controversy about the ages is significant, because low-mass stars are typically found to have younger ages than higher-mass stars; we refer to Luhman & Esplin (2020) for references and a recent discussion of this issue. A popular view interprets the young stellar population in Sco-Cen as the results of triggered or sequential star formation. According to Preibisch & Zinnecker (1999), star formation began in UCL approximately 15 Myr ago. After the most massive UCL stars exploded as super novae, the resulting shock waves would have triggered star formation in the neighboring regions. For a more extensive discussion of the Sco-Cen complex and the young local associations, we refer to Fernández et al. (2008).
To assess the formation history of the Sco-Cen association, a list of members that is as complete as possible clearly is a necessary requirement. However, assigning membership of individual stars to the Sco-Cen association has always been a problem, and even in the case of the far fewer more massive stars, Rizzuto et al. (2011) argued that inclusion of more information (in their case, radial velocities) leads to changes in the detailed membership lists. The problem of membership assignment becomes even more severe for the far more abundant lower mass stars. de Zeeuw et al. (1999) already identified stars of later spectral type, but regardless of the specific membership lists used, the sensitivity limitations of HIPPARCOS make it clear that only a very small fraction of the low-mass stellar population can be identified with these data. For the specific case of US, Preibisch & Mamajek (2008) estimated that 75% of the US member stars have masses below 0.6 M⊙, which accounts for only 39% of the total stellar mass, however. Thus, rather substantial numbers of low-mass stars must exist in the Sco-Cen region, and numerous studies involving rather different strategies have been carried out to search for members of this low-mass stellar population (cf. Preibisch & Mamajek 2008 for an overview).
Reliable membership lists are obviously a non-negotiable prerequisite for all empirical determinations of the initial mass function, which in turn provide the link between observations and theory. For a thorough review of IMF research, we refer to Kroupa et al. (2013). Preibisch et al. (2002) presented a determination of the IMF in the US region, distinguishing between the high-mass and low-mass stellar populations. While the high-mass members are known (but see Rizzuto et al. 2011), the low-mass members are much harder to identify, and the area surveyed by Preibisch et al. (2002) only extended over 9 deg2, a small fraction of the whole US region (cf. Fig. 4).
Given the large extent of the full Sco-Cen region, it is clear that any construction of reliable membership lists a challenging task. As succinctly described by Damiani et al. (2019), the whole Sco-Cen complex comprises a volume of about 1.6 × 10⁶ pc3, in which the Gaia DR2 catalog lists several hundred thousand stars, depending on the chosen selection criteria. As a consequence, the sought-for young stellar population comprises only a small fraction of the overall stellar population, and because a detailed spectroscopic inspection of all stars is not (yet) feasible, efficient search criteria need to be applied. Preibisch & Mamajek (2008) provided a detailed overview of the various methods that were applied to identify the optically rather faint low-mass stellar population. Spectroscopic investigations typically focus upon Hα emission as a chromospheric (or accretion) indicator and on lithium as a youth indicator. Photometric investigations in the infrared attempt to identify the very low mass stellar and brown dwarf population, and finally, kinematic membership criteria insist that the members’ space motions are almost parallel. Preibisch & Mamajek (2008) summarized the identification efforts of Sco-Cen low-mass members (to a large extent based on ROSAT data) and presented separate lists of US, UCL, and LCC members, a large fraction of which are known X-ray sources. Yet the overall completeness of the membership lists remained unclear, given the large sky area covered by the proposed members, given the lower sensitivity of ROSAT compared to eROSITA, and given the lack of high-accuracy parallaxes and photometry, which are now provided by Gaia. Further searches for low-mass members in US have been performed, for example, by Rizzuto et al. (2015), and for the whole Sco-Cen region, Pecaut & Mamajek (2016) presented a sample of 493 stars in the mass range 0.7 M○ < M*, < 1.3 M○, which they argue are “likely members” based on lithium absorption, dwarf or subgiant surface gravities, kinematic distances consistent with Sco-Cen membership, and HR position consistent with Sco-Cen membership.
With the advent of Gaia (Global Astrometric Interferometer for Astrophysics, but there is no interferometer on board; Gaia Collaboration 2016) and eROSITA (Predehl et al. 2021), the observational situation with respect to the Sco-Cen association and the problem of membership determination has completely changed. Both Gaia and eROSITA are ongoing survey missions. Their “final” results are likely available only toward the end of the decade. The enormous potential of these new data sets can be demonstrated already with existing data, however, and it is the purpose of this paper to demonstrate that the combination of Gaia, yielding decisive information on distance, kinematics, and evolutionary status, and eROSITA, yielding decisive information on stellar activity, does reveal the full extent of the expected low-mass stellar population.
The outline of our paper is as follows: we describe the basis for the Gaia and eROSITA revolutions in Sect. 2 and elucidate the role of stellar youth and activity for the assignment of membership in Sco-Cen in Sect. 3. The new data and our analysis are briefly described in Sect. 4, and our new results are presented in Sect. 5. We conclude with a discussion and our conclusions in Sect. 6.
2 The Gaia and eROSITA revolutions
The Gaia (launched in December 2013) and Spectrum-Roentgen-Gamma (SRG) missions (launched in July 2019) are likely to revolutionize our understanding of star formation in the Sco-Cen region and in general. The Gaia mission is an ESA large mission devoted to the precise measurement of positions, magnitudes, distances, and space velocities of more than a billion stars. A detailed description of the Gaia hardware, its scientific goals, and in-orbit performance is given by the Gaia Collaboration (2016). So far, the Gaia project has released Gaia data in three steps: Gaia DR1 in 2016, Gaia DR2 in 2018, and an (early) release Gaia EDR3 in 2020; further data releases are envisaged in the coming years. Specifically, Gaia EDR3 contains positions, proper motions, and parallaxes for about 1.468 × 10⁹ sources. Because Gaia is expected to operate at least until 2022 and possibly longer, a “final” Gaia catalog is not likely to be available any time soon. For the purposes of this paper, we therefore work with Gaia EDR3 data.
The eROSITA instrument (extended ROentgen Survey with an Imaging Telescope Array) is the soft X-ray instrument on board the Russian-German Spectrum-Roentgen-Gamma (SRG) mission. After its launch from Baikonur, SRG was placed into a halo orbit around L2, where it is performing a four-year-long all-sky survey, which started in December 2019. The eROSITA all-sky survey is carried out in a way similar to the ROSAT all-sky survey, that is, the sky is scanned in great circles perpendicular to the plane of the ecliptic. The longitude of the scanned great circle, that is, the survey rate, moves by ~1° per day, which means that after half a year the whole sky is covered. This procedure will be carried out eight times over the mission lifetime.
This paper deals with data obtained during the first of the eight eROSITA all-sky surveys. SRG is scanning all the time with a scan rate set to 90° per hour, that is, one SRG revolution lasts 4 hours. Given the eROSITA field of view (FOV) of 1°, a source will be observed for up to 40 s depending on its location with respect to the precise scan path of eROSITA. Furthermore, a source near the plane of the ecliptic enters and leaves the eROSITA scan path within a day and is thus observed six times. Sources at higher ecliptic latitudes can be observed up to several weeks, but again with the same cadence of 4 h. As a consequence, the sensitivity of the eROSITA all-sky survey strongly depends on ecliptic latitude. After the end of the eROSITA all-sky survey, the data of all eight individual surveys will be merged to yield the final eROSITA survey.
The eROSITA instrument is composed of seven X-ray telescopes, each equipped with their own CCD camera in the respective telescope’s focal plane. All seven telescopes and cameras are operated independently, but they all observe in parallel. Except for some slight differences in the filters, the seven units are identical and thus provide a high degree of redundancy of the total system. The eROSITA energy range is between 0.2 and 8 keV. Its spectral resolution approaches 80 eV at an energy of 1 keV, which is significantly higher than that obtained by the ROSAT PSPC and opens up entirely new scientific investigations. A detailed description of the eROSITA hardware, mission, and in-orbit performance is presented by Predehl et al. (2021).
The anticipated minimum (point source) flux limit of the ongoing eROSITA all-sky survey is expected to be about 1 × 10⁻¹⁴ erg cm−2 sec−1 and thus exceeds the ROSAT survey flux limit by a factor of at least 20. With increasing ecliptic latitude, the minimum flux decreases even further. A simple formula to determine the flux limit of eROSITA is given by the expression  (in cgs units), which implies a (minimum) limiting X-ray luminosity of about 1.5 ×1028 erg s−1 at a distance of 120 pc.
Gaia data have already been used for studies of the Sco-Cen association: Damiani et al. (2019) presented a first study of the stellar content of the whole Sco-Cen complex based on Gaia DR2 data. To identify the young low-mass stellar population in Sco-Cen, Damiani et al. (2019) carried out a selection both in proper motion and color-magnitude diagram (CMD) space. Specifically, Damiani et al. (2019) selected stars in the Sco-Cen region by first demanding that their distance was below 200 pc, second, demanding that their proper motions or transverse velocities were located in some specified polygonal region in the proper motion or transverse velocity plane, where already known members are located, and third, that the stars be located in again a specially selected area above the main sequence, their so-called “PMS locus”. Using these techniques, Damiani et al. (2019) found 2862, 4511, and 2803 low-mass members (with approximate BP-RP colors >1) in the US, UCL, and LCC regions, respectively. If transverse velocity filtering is applied, these numbers change to 2587, 4077, and 2154 in US, UCL, and LCC, respectively; cf. Table 1 in Damiani et al. (2019).
A similar effort involving Gaia DR2 data was undertaken by Luhman & Esplin (2020), who concentrated on US and also used kinematics and photometry primarily from Gaia to isolate candidate Sco-Cen members. In contrast to Damiani et al. (2019), Luhman & Esplin (2020) introduced a mixture model to separate Sco-Cen members and field stars. Luhman & Esplin (2020) then combined these selections with a vast body of optical photometry and spectroscopy to arrive at a “final” list of 2020 stars, 1761 of which were classified as “true” US members, while no detailed membership assignment was performed for the UCL and LCC regions.
Neither Damiani et al. (2019) nor Luhman & Esplin (2020) used magnetic activity diagnostics in their attempts to define suitable membership criteria. However, with the advent of the eROSITA all-sky survey (eRASS; cf. Predehl et al. 2021) a new X-ray data set has become available that covers the whole Sco-Cen region with substantially greater sensitivity and spectral coverage than the ROSAT all-sky survey carried out in the early 1990s. We demonstrate in Sect. 3 that first, young low-mass star Sco-Cen members must be vigorous X-ray emitters and second, that the eROSITA sensitivity allows an essentially complete detection of this stellar population.
3 Young stars and the role of stellar magnetic activity
In the past decades, overwhelming evidence has been produced that all young stars are indeed very rapid rotators (see, e.g., the review by Bouvier et al. 2014). According to the rotation-activity paradigm, for late-type stars with outer convection zones, rapid rotation is intimately linked with magnetic activity, which manifests itself, among other signatures, in X-ray emission. The evidence is overwhelming that all stars with outer convection zones are X-ray sources (Schmitt 1997). The parameter controlling the observed ratio of X-ray (LX) and bolometric luminosity (Lbol) of a given star appears to be the so-called Rossby number, which is defined as the ratio of rotation period Prot and convec-tive turnover time τconv. Theoretical calculations of τconv (see, e.g., Landin et al. 2010) yield values between 10 and 15 days (for stars with effective temperatures of about 6000 K) to values above 100 days and more (for stars with effective temperatures of 4000 K and below).
Numerous studies of rotation periods for low-mass stars have been carried out for open clusters with various ages (cf. the overview by Bouvier et al. 2014 and references therein). The initial spin rates (for ages younger than ~2 Myr) seem to be distributed between 1 and 10 days, and relatively little rotational spin-down takes place for the first 100 Myr in the life of a cool star. Afterward, spin-down is observed, and by the age of the Hyades cluster (625 Myr), rapid rotation is observed in only a few of its lowest-mass members. The low-mass member stars of the Sco-Cen association must have ages not exceeding 20 Myr, for instance, because no O-type stars remain. Approximately the original period distribution is therefore expected, implying that the low-mass stars with masses below 0.8 M⊙, for instance, invariably have Rossby numbers far below unity.
Wright et al. (2011) presented a compilation of pre-TESS rotational and pre-eROSITA X-ray data for 824 late-type stars. Figure 2 in Wright et al. (2011) shows that stars with Rossby numbers below ~0.1 are observed to cluster around a so-called saturation limit of approximately LX/Lbol ~ 10−3, while for stars with larger Rossby numbers, the observed LX/Lbol-values decrease with increasing Rossby number, leading to the so-called rotation-activity connection. While no real physical basis forthis saturation limit is known, the saturation limit is well established empirically, and it remains a challenge to find coronal X-ray emitters that do violate the saturation limit. Coupling the evolution of magnetic activity to a rotational evolution model, we find that low-mass stars of spectral type K and M stay longer in the saturated regime than higher mass stars (Johnstone et al. 2015). This emphasizes that X-ray surveys are important to characterize this population of low-mass stars. In summary, the low-mass stellar population in the Sco-Cen association is expected to be clustered around the X-ray saturation limit. This saturation limit in our eROSITA data is discussed in Sect. 5.4.
As a consequence of this saturation limit, the optical counterparts of coronal X-ray sources in a flux-limited X-ray survey such as eROSITA will also be (optically) flux limited. Using specifically the mean stellar color and effective temperature sequence compiled by Pecaut & Mamajek (2013), it is straightforward to compute the X-ray luminosity LX for a saturated coronal emitter and hence its apparent X-ray flux fX, assuming a distance of 120 pc as appropriate for bulk of the Sco-Cen association as a function of effective temperature (red data points in Fig. 1). For the same object, we can use its bolometric luminosity, apply the bolometric correction to the Gaia band as described by Andrae et al. (2018), and compute its apparent Gaia G magnitude, again assuming a distance of 120 pc as a function of effective temperature (blue data points in Fig. 1). Figure 1 shows that at this distance of 120 pc, all objects hotter than 3000 K are brighter than G ~ 20 mag and are therefore expected to (eventually) have measured Gaia parallaxes. At the same time, these objects would be detectable X-ray sources in X-ray observations with a limiting flux of ≈7 × 10⁻¹⁵ ergs−1 cm−2, while shallower X-ray surveys are expected to detect only hotter stars depending on the actual flux limit.
According to Merloni et al. (2012), eROSITA is expected to reach a limiting flux of at least 1 × 10⁻¹⁴ erg s−1 cm−2 essentially over the whole sky, which would correspond to an effective temperature of ~3100 K or a spectral type of ~M4V. In higher ecliptic latitude regions, to which, for example, the LCC region belongs, substantially lower sensitivities can be reached. A limit of 1 × 10⁻¹⁵ erg s−1 cm−2, for example, would correspond to an effective temperature of ~2500 K or a spectral type of ~M7V. The saturation limit is not fulfilled exactly, however. As we demonstrate below (see Fig. 9), there is substantial scatter, the cause of which is unclear. These numbers demonstrate, however, that essentially the whole low-mass stellar population in the Sco-Cen region should be detectable as X-ray emitters by eROSITA.
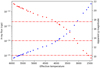 |
Fig. 1 X-ray flux for a saturated coronal source at a distance of 120 pc vs. effective temperature (red data points) and apparent Gaia G magnitude for the same objects (blue data points). The dash-dotted lines refer (from top to bottom) to limiting flux levels for the ROSAT all-sky survey, the minimum eROSITA all-sky survey, and to a hypothetical limiting eROSITA flux at high ecliptic latitudes. See text for details. |
4 Data and data analysis
For our eROSITA pilot study of the young stellar population of Sco-Cen, we used the results of the first of eight planned eROSITA all-sky surveys, using the processing results of the eSASS pipeline (currently, version 946). A detailed description of this software and the algorithms we used is given by Brunner et al. (2022). Briefly, the eSASS system performs source detection and creates X-ray catalogs for each sky tile with a size of 3.6° × 3.6°; note that neighboring sky tiles are overlapping. The X-ray sources in the individual tiles are then merged into one large catalog, in which duplications in the overlap regions are removed and astrometric corrections are applied. The quoted catalog count rates are fiducial count rates that would be obtained if the source in question had been observed by all seven eROSITA telescopes on-axis. We note that during the survey, the off-axis angle changes all the time, and furthermore, not all seven telescopes may deliver useful data at all times due to calibration activities or malfunction.
The software performs source detection in the energy bands 0.2–0.6 keV, 0.6–2.3 keV, and 2.3–5.0 keV and also considers a total band 0.2–5.0 keV. Because stellar coronae tend to be rather soft X-ray emitters compared to active galactic nuclei, we only used the energy bands 0.2–0.6 keV and 0.6–2.3 keV. We added the count rates obtained in the two lower-energy bands and used an energy conversion factor of (ECF) of 9 × 10⁻¹³ erg cm−2 cnt−1 to convert count rates into energy fluxes. This ECF is appropriate for a thermal plasma emission with a temperature of 1 keV and an absorption column of 3 × 1019 cm−2. No attempt was made to apply individual conversion factors to individual sources based on their X-ray spectra. The quoted X-ray fluxes then refer to the band 0.2–2.3 keV, which matches the ROSAT band well.
To associate the eROSITA X-ray sources with Gaia EDR3 entries, we followed the approach described by Schneider et al. (2022). The most important ingredient in the matching process is clearly the position, and the positional offsets between X-ray and optical positions are well known. The Gaia EDR3 release contains 1811709771 entries with a very inhomogeneous distribution over the sky. The Gaia source density amounts to 3.4 × 10⁻³ entries per arcsec2 on average, implying an average number of 0.27 sources in a randomly chosen circular detection cell of 5″ radius. In other words, every fourth match would be a random match. At low galactic latitudes such as in the Sco-Cen region, the actual source densities are far above average, which aggravates the confusion problem.
To reduce the number of random matches, it is therefore of paramount importance to reduce the number of possible matching candidates. To this end, we introduced the concept of “eligible” stars, that is, stars that conform to our preconceived notions of what X-ray emitting stars should look like. As a first step, we accept as eligible stellar counterparts only Gaia EDR3 entries with a measured parallax (with a signal-to-noise ratio of the parallax S /N > 3), brighter than a G magnitude of 18 mag, and with measured Gaia BP-RP colors. Any object violating these criteria may well be an X-ray emitter, but it is extremely unlikely that it is a coronal X-ray emitter. Confusion with fainter background sources is always a problem, in particular, when rare source classes are searched for (cf. the example of HR 4289 described by Huensch et al. 1996). The experience we have gained so far suggests, however, that this occurs only in very few cases.
It is very important to realize that the optical properties of a typical stellar eROSITA counterpart are quite different from those of a randomly chosen (even stellar) Gaia EDR3 entry: in the eFEDS field, for example, we find for the median distance of stellar Gaia entries a value of 1.1 kpc, that is, the vast majority of these stars are giants of spectral type G or K that can optically be detected out to large distances. However, from the X-ray point of view, these stars are normally quite faint. For example, the bright nearby giant Arcturus (V = −0.05) is barely detected at X-ray wavelengths (Ayres 2018) at a level about one hundred times weaker than the already weak Sun, while an X-ray source detected at a median distance and at the sensitivity limit would result in an X-ray luminosity of >1030 erg s−1. These X-ray luminosities can be attained by rapidly rotating FK Com or RSCVn systems, but in general, distant giants are implausible X-ray sources. To counter the erroneous association of an eROSITA X-ray source with Gaia eligible stellar background sources, we therefore devised a selection procedure favoring nearby, brighter, and red objects over more distant, fainter, and yellower stars. A much more detailed discussion of the whole stellar identification problem is provided by Schneider et al. (2022).
To illustrate the positional coincidence of eRASS1 and Gaia EDR3 positions, we constructed the deviation histograms for the Gaia and eROSITA catalog positions shown in Fig. 2 separately for the US, UCL, and LCC populations discussed in Sect. 5.1. The positional agreement is clearly excellent; the bulk of the sources is located well inside 5 arcsec. A few sources have matching distances above 10 arcsec, but all of these sources have large position errors in the eRASS1 data. When the positional deviation is normalized by the derived position errors, the distribution of the normalized errors as shown in Fig. 3 (blue data points) is very well described by a Rayleigh distribution (red curve in Fig. 3). Figures 2 and 3 therefore clearly show first, that the bulk of the stellar sources in Sco-Cen is identified correctly, second, that the contamination level is very low, and third, that the (positional) completeness of the sample is very high. Very importantly, we can conclude that through the excellent positional accuracy of the eROSITA survey data, reliable stellar identifications with low contamination can also be obtained at low galactic latitudes, where the Gaia stellar densities are indeed very high.
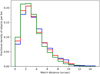 |
Fig. 2 Histogram of position deviations (in arcsec) between eRASS1 and Gaia EDR3 positions for bona fide US members (blue histogram), UCL members (red histogram), and LCC members (green histogram). |
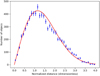 |
Fig. 3 Histogram of normalized position deviations (dimensionless) between eRASS1 and Gaia EDR3 positions for bona fide Sco-Cen members (blue data points) and Rayleigh distribution (red curve). |
5 Results
5.1 2D and 3D view of stellar X-ray sources in the Sco-Cen association
In Fig. 4 we plot all detected eRASS1 point-like X-ray sources (black data points) in the US, UCL, and LCC regions following the convention by Preibisch & Mamajek (2008) for the definitions of the respective US, UCL, and LCC regions. To associate the detected X-ray sources with Gaia EDR3 entries, we followed the procedures described in Sect. 4, and following Damiani et al. (2019), we used a distance screening that accepted only stars located between 60 pc and 200 pc (as calculated from their Gaia measured parallaxes ignoring any errors) as bona fide Sco-Cen member candidates.
We further note that exposure effects were not removed from Fig. 4. The southern ecliptic pole is located near l ~ 276° and b ~ −31°, and the increased apparent source density in the lower right corner of Fig. 4 is caused by the increasing eROSITA exposure in this region. Proceeding in this fashion, we identified a total of 7992 matches with Gaia stellar counter parts and X-ray sources in the Sco-Cen region (1391 in US, 3112 in UCL, and 3419 in LCC), which would constitute a preliminary sample of X-ray selected bona fide Sco-Cen candidate members. We emphasize that the vast majority of these candidate members are of low mass, with Gaia BP-RP colors in excess of unity. According to the color tables presented by Pecaut & Mamajek (2013), the Gaia color BP-RP = 1 corresponds to a spectral type K0. More specifically, when considering counterparts with BP-RP > 1, we find 1108 low-mass US candidate members, 2417 low-mass UCL candidate members, and 2665 low-mass LCC candidate members. This shows that the percentage of K- and M-type objects among the candidate stars is almost 80%, as would be expected from the initial mass function.
Gaia provides precise distances to all the stellar X-ray sources shown in Fig. 4. For visual orientation, we present in Fig. 5 a 3D view of all stellar sources in the fourth galactic quadrant using the usual (X,Y,Z) coordinate system. The positive X-axis points toward the galactic center, the positive Y-axis in the direction of galactic rotation, and the Sun is located at (0, 0,17). For the height of the Sun above the galactic plane, we refer to the discussion by Karim & Mamajek (2017) for the results of the research of one hundred years for this value. Figure 5 shows that the eROSITA-detected X-ray sources are distributed along a torus-like structure with substantial substructure. For orientation, some of the better-known regions are identified in Fig. 5: the positions of the US, UCL and LCC regions are marked (they are quite large, cf. Fig. 4). Furthermore, the young clusters IC 2602 and IC 2391, the η Cha cluster, and the V1062 Sco cluster as well as the star-forming regions in the Chameleon and Lupus constellations, the location of the dark clouds associated with Barnard 59, and the Corona Australis are also indicated.
5.2 Color-magnitude diagram of stellar X-ray sources in the Sco-Cen association
Which type of objects are these X-ray selected bona fide Sco-Cen candidate members? Because we also have the Gaia G magnitude, parallax, and BP-RP color for every X-ray source, we can construct a color-magnitude diagram (CMD) for these stars, which represents the central result of this study and is shown in Fig. 6 for all the US, UCL, and LCC low-mass candidate member stars. We note that the relevant eROSITA data are provided and described in Appendix A.1. In addition to the derived CMD positions of the US, UCL, and LCC candidate member stars, we plot isochrones using the PARSEC suit of isochrones (in version 1.2S, see Bressan et al. 20121) for selected ages in the range between 106 and 109 yr. In this context, we note that we did not apply corrections for absorption or binarity to calculate the CMD positions. According to Andrae et al. (2018), the reddening vector in a (G–BP-RP) color-magnitude diagram is characterized by the relation AG ~ 2 × E(BP-RP), where E(BP-RP) is the BP-RP color excess. This implies that reddening moves a star very approximately along its isochrone and makes it an even lower-mass star. Preibisch & Mamajek (2008) provided visual AV measurements for their US, UCL, and LCC members that in their great majority are rather low. We therefore expect absorption effects to be low in general, but individual sources near dark clouds or with an almost edge-on disk geometry may be substantially affected. A more severe problem might be unresolved binaries. Binarity (assuming two equal-mass components) moves a star by 0.75 mag upward in the CMD, which decreases its apparent age. Assessing the binarity of all sample stars is currently not possible. Finally, there are bound to be systematic errors in the isochrones, especially for the lowest-mass stars that are difficult to quantify. Our ages are therefore only appropriate in the context of the PARSEC isochrones we used.
Inspection of Fig. 6 shows that the vast majority of the X-ray selected stars are located between the 106 and 109 yr isochrones. We point out again in this context that the only filtering applied was that first, the sources are in the distance range 60–200 pc with a parallax significance of at least 3, and second, they are X-ray detected. We also note that a few stars are located up to 3 mag below the 109 yr isochrone and another few points are located above the 106 yr isochrone.
The open cluster IC 2602, the southern Pleiades, is located at the easternmost end of our selected LCC region in the constellation Carina, visible as a blob in Fig. 4 at location (l ~ 289°, b ~ −5°). The question arises whether it really belongs to LCC. Various attempts to measure the age of IC 2602 have been made; see Silaj & Landstreet (2014) for an overview. For IC 2602, Silaj & Landstreet (2014) quoted ages between 10 and 68 Myr, while Stauffer et al. (1997) derived an age of 25 Myr using isochrone fitting to PMS stars. The most robust estimate is probably the lithium depletion boundary age of 46 Myr derived by Dobbie et al. (2010). Because the notion of a wave of star formation propagating from LCC to US is quite popular (cf. Preibisch & Mamajek 2008), it would be attractive to interpret IC 2602 as one of the older relics of this process.
Similar considerations apply to the region near (l ~ 343°, b ~ 5°) in the UCL, which is also clearly visible as an enhancement in Fig. 4. We associate this group with the young compact moving group around the star V 1062 Sco that was described by Röser et al. (2018). V 1062 Sco is a peculiar system of the type α2 CVn. The group contains about 60 stars with ages between 10 and 25 Myr at a distance of 175 pc. Röser et al. (2018) also discussed the relation of this moving group to the UCL complex and instead interpreted it as a subcondensation in velocity space, which is not coeval, however.
To include possible members of IC 2602 and V 1062 Sco, we therefore opted for a somewhat generous selection of Sco-Cen member candidates in the CMD. As shown by Gaia Collaboration (2018), the Gaia observed main sequence of the Pleiades agrees very well with the PARSEC 108 yr isochrone, and we therefore selected as low mass Sco-Cen candidate members all eROSITA detected stellar sources in the respective US, UCL, and LCC regions (see Fig. 4), with colors BP-RP > 1.0 (focusing on K- and M-type stars) that are situated between the PARSEC 106 and 108 yr isochrones.
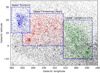 |
Fig. 4 eRASSl X-ray sources in the fourth galactic quadrant between −10° < b < 30°. The nominal regions of the Sco-Cen subgroups as defined by Preibisch & Mamajek (2008) are indicated. The colored sources indicates the sources identified with Gaia stars in the distance range 60–200 pc. Blue sources indicate US member candidates, red sources show UCC member candidates, and green sources represent LCC member candidates. Typical eRASS1 position errors are 4 arcsec. |
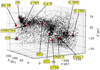 |
Fig. 5 3D view of detected eRASS1 stellar X-ray sources in the fourth galactic quadrant in the (X,Y,Z) coordinate system. For orientation, some individual objects or regions in the Sco-Cen association are indicated. See text for details. |
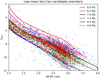 |
Fig. 6 Color-magnitude diagram of low-mass stellar X-ray sources in the US (blue data points), UCL (red data points), and LCC (green data points) regions together with PARSEC isochrones (Bressan et al. 2012). The photometry errors are very small. Parallax errors are typically at the percent level with large variations. |
5.3 Kinematics of stellar X-ray sources in the Sco-Cen association
Traditionally, kinematics played an important if not decisive role in the membership definition of Sco-Cen, while our X-ray based membership assessment so far has ignored kinematics altogether. Therefore it behooves us to check the kinematics for our X-ray and CMD selected Sco-Cen candidate members. As is apparent from Fig. 4, we are studying rather large regions on the sky extending over almost 90 degrees in longitude, and as a consequence, projection effects can smear out the measured proper motions or tangential velocities even for a population that moves exactly in parallel, raising the question as to what extent this population actually moves parallel in 3D space. Gaia currently does not provide 3D velocity vector information for all Sco-Cen stars, but we found radial velocities for a the subset of our low-mass Sco-Cen candidates (260 US candidate members, 510 UCL candidate members and 483 LCC candidate members; see Table 1) in Gaia EDR3; note that the quoted errors in radial velocity can be quite substantial. It is also clear, however, that for a substantial fraction of our bona fide members, radial velocities and hence 3D vectors are not (yet) available.
Johnson & Soderblom (1987) provided a detailed discussion of velocity vectors and their transformations. We work with radial velocities and tangential velocities in the direction of right ascension and declination (ρ, vt,α, vt,δ), where the tangential velocities are computed from the Gaia measured proper motions and parallaxes. As shown by Johnson & Soderblom (1987), the transformation between the observed velocity vector (ρ, vt,α, vt,δ) and the true space motion vector (U, V, W), with component U denoting the velocity component toward the galactic center, component V the component along the galactic rotation, and component W the component toward north, is given by a linear transformation of the form
![Mathematical equation: $\left[{\matrix{U \cr V \cr W \cr}} \right] = {\bf{T}} \cdot {\bf{A}} \cdot \left[ {\matrix{\rho \cr {{\upsilon_{{\rm{t}},\alpha}}} \cr {{\upsilon_{{\rm{t}},\delta}}} \cr}} \right],$](/articles/aa/full_html/2022/05/aa41132-21/aa41132-21-eq2.png) (1)
(1)
where the matrices T and A only depend on the orientation of the galactic coordinate system with respect to the equatorial system and the coordinates of the objects. As discussed above, for the majority of our sources, we are still lacking measurements of ρ. Therefore the individual (U, V, W) components cannot be computed, but tangential velocities are available for all sample objects. For a stellar population moving parallel in space, that is, with constant (U, V, W) but dispersed in distance and position, the distribution of these objects can be found, for example, in the observed (vt,α, vt,δ)-plane, that is, the tangential velocity plane. In Fig. 7 we plot the tangential velocities for all our X-ray and CMD selected Sco-Cen candidate members in our usual color scheme and note a clear clustering in the tangential velocity plane.
Equation (1) shows that the measured tangential velocities (vt,α, vt,δ) depend linearly on the three space velocity components. Assuming now a source population in parallel motion, but sufficiently distributed in 3D space, we can (analytically) determine a best-fit 3D velocity vector from the set of measured tangential velocities and the available radial velocities. Each individual measurement  depends linearly on (U, V, W) and thus a best fit, for example, in a least-square sense, can be obtained by minimization. Furthermore, in practice, the stellar motions under consideration will not exactly be parallel, but maintain some dispersion from their parent molecular clouds. To assess the maximum possible extent of a population that moves in parallel in tangential velocity space, we first identified the obvious over densities in the tangential velocity space associated with the US, UCL, and LCC population (from which we separated the IC 2602 population) and determined best-fit (U, V, W) velocity vectors for the respective populations by minimizing the distance between modeled and measured velocity components. With the best-fit (U, V, W) values obtained in this way (see Table 1), we then carried out a Monte Carlo calculation, assuming ad hoc a velocity dispersion in each component, and computed the resulting (vt,α, vt,δ) distributions. To arrive at a simple description of these distributions, we constructed ellipses containing 99% of the Monte Carlo points. These ellipses are also shown in the (vt,α, vt,δ) plane for a population of US, UCL, LCC, and IC 2602 moving in parallel, and all the stars located inside the ellipses can be considered to move in parallel in space.
Figure 7 shows that a considerable fraction of data points are located inside the respective ellipses, that is, the stars form a kinematic entity, but a significant number of data points are located outside, with the precise numbers again being provided in Table 1. If we were to carry out a membership search based on kinematic criteria alone, the objects located outside would be missed. It is difficult to answer whether membership based on kinematics alone should therefore be rejected, and this requires further study. We can definitely say, however, is that the compactness is reduced from US to UCL and LCC, and the data points located outside are also not randomly distributed, but appear to diffuse out preferentially along the right ascension direction.
We further investigated the distance distributions of the populations defined in this way and found them quite different. In Fig. 8 we show the volume density of young low-mass stars (in terms of objects per pc3) for the UCL region; the red data points refer to the kinematic UCL members, the blue data points to the kinematic non-members. Figure 8 clearly demonstrates that the population that is compact in velocity space is also spatially far more concentrated at distances between 120 and 140 pc, while the population that is diffuse in velocity space is spread out almost uniformly over the range of distances we considered, and the gradient is probably due to the reduced sensitivity at larger distances.
Results of space motion determinations for low-mass Sco-Cen members.
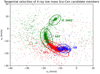 |
Fig. 7 Tangential velocities of low-mass stellar X-ray sources in the US (blue data points), UCL (red data points), and LCC (green data points) regions. The majority of the population is contained in the plotted ellipses, but a population exists that is rather diffuse in velocity space. See text for details. |
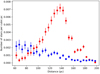 |
Fig. 8 Volume density of young stars (in units of objects per pc3) for the kinematic UCL members (red data points) and cospatial but kinematic nonmembers (blue data points). |
5.4 X-ray properties of stellar X-ray sources in the Sco-Cen association
We now explore the X-ray properties of the various populations identified in Sect. 5.3. Using the eROSITA measured X-ray fluxes and Gaia measured distances, we can compute the X-ray luminosities for our sample stars. Furthermore, using the measured Gaia BP-RP colors and the bolometric corrections as described by Andrae et al. (2018) and ignoring any possible absorption effects, we can compute bolometric luminosities Lbol for all the sample stars and proceed to compute their LX/Lbol ratios. For the sake of more clarity, we consider the compact and diffuse populations as defined in Fig. 7 separately and show in Fig. 9 the measured LX/Lbol values as a function of BP-RP color for low-mass kinematic members (i.e., the stars located in the respective ellipses shown in Fig. 7) in the US. Figure 9 clearly demonstrates the relevance of the saturation limit. The vast majority of the kinematic members and nonmembers are saturated, and only a few of the bluer stars in the UCL and LCC regions deviate toward lower values, with the vast majority being kinematic nonmembers. Some of the (blue) US members show LX/Lbol ratios of 10−4 and below, and it is not clear whether, for example, absorption effects cause this anomaly; the older UCL and LCC populations do not show such effects.
Especially the redder stars include a few objects whose LX/Lbol values are higher than 10−3. We point out in this context that all X-ray luminosities and bolometric luminosities reported in this paper were not measured contemporaneously. Therefore X-ray flaring is an obvious possibility to explain anomalously high LX/Lbol values, but the decay times of stellar flares are typically of the order of hours at best, but (usually) not of days (but see Kuerster & Schmitt 1996 for a striking exception). It remains to be seen whether the further eRASS surveys will confirm these values. Clearly, with eight surveys at hand, a characterization of the mean X-ray luminosity of a star is far more robust. We finally emphasize that in addition to the mere fact of X-ray detection, no further X-ray properties were used in our identification process, and therefore Fig. 9 constitutes a nice example for the validity of our approach because objects with high LX/Lbol values are not discriminated against.
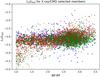 |
Fig. 9 LX/Lbol vs. BP-RP color for low-mass kinematic member X-ray sources in the US (blue crosses), UCL (red crosses), and LCC (green crosses) regions as well as low-mass kinematic nonmembers drawn as pluses with the same color code. The saturation limit for stars with BP-RP > 1.5 is well developed in both populations. |
5.5 Ages of stellar X-ray sources in the Sco-Cen association
Except for kinematics, there are some but not many differences in the X-ray properties of the stars in the compact and diffuse population. An obvious question to ask is whether the age distributions of the populations differ and how this may affect the X-ray emission of the stars. Because we know the location of each star in the CMD (cf. Fig. 6), we can determine the age of each star by comparison with the PARSEC isochrones. The age distributions determined in this way are plotted in histogram form in Fig. 10 for the compact population in the US, UCL, and LCC regions (solid histograms) and for the diffuse population (dashed histograms), respectively. Figure 10 clearly demonstrates that the age distributions of these populations are indeed different. Only a smaller fraction of the diffuse population has nominal ages below 10 Myr, the bulk of the derived ages is well above 10 Myr, while in the case of the compact population, only a tiny fraction has nominal ages above 30 Myr.
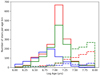 |
Fig. 10 Age distribution histogram for low-mass kinematic member X-ray sources in the US (blue histograms), UCL (red histograms), and LCC (green histograms) regions. The solid histograms describe the compact population, and the dashed histograms the diffuse populations. See text for details. |
5.6 Comparison to previous work
For our selection of Sco-Cen members, X-ray emission does play a decisive role, but we need to determine how well (or poorly) the X-ray selection compares to more traditional selection procedures. To this end, we compared our eROSITA derived results with previous studies. Specifically, we compared our findings to the ROSAT based study by Preibisch et al. (1998), who obtained lithium spectroscopy for X-ray selected members and proper motion selected members without X-ray detections. Furthermore, we compared our results to the membership lists derived by Pecaut & Mamajek (2016), Damiani et al. (2019), and Luhman & Esplin (2020). As we discussed in Sects. 1 and 2, previous membership lists of Sco-Cen members have been published that were based on rather different selection methods and on different data sets, which we discuss in turn below. Preibisch et al. (1998) and Pecaut & Mamajek (2016) only used pre-Gaia data, while Damiani et al. (2019) and Luhman & Esplin (2020) used Gaia DR2 data to various extents.
5.6.1 Comparison to the membership lists derived by Preibisch et al. (1998)
Preibisch et al. (1998) selected a 160 square degree region in US (cf. their Fig. 1) and primarily used ROSAT all-sky survey data (RASS, in addition to some deeper pointed ROSAT data) in that area. Preibisch et al. (1998) reported a total of 606 X-ray sources in their specified survey region and obtained spectroscopy for 69 RASS sources (out of 130 selected candidate members). In addition, Preibisch et al. (1998) obtained spectroscopy for 115 stars that they deemed to be Sco-Cen members based on their proper motions but remained undetected at X-ray wavelengths. In 39 (out of 69) stars, Preibisch et al. (1998) detected a lithium equivalent width above the threshold value (cf. their Fig. 3), while none of the X-ray quiet proper motion candidate members showed significant lithium absorption. Comparing the RASS performance to eROSITA, a total of 3556 sources are found in the same area (already in eRASS1), out of which 868 are bona fide low-mass US members. Interestingly, in eRASS we do not recover all of the 69 RASS sources reported by Preibisch et al. (1998). For 14 of them, no eRASS1 detection could be obtained, while only 2 of the 115 proper motion candidate members resulted in an eRASS1 detection. This clearly shows that already eRASS1 supersedes the RASS numbers considerably, and the final eRASS8 data will again be much deeper and will in addition allow us to address long-term variability in the X-ray sources in the Sco-Cen region.
5.6.2 Comparison to the membership lists derived by Pecaut & Mamajek (2016)
In another pre-Gaia study, Pecaut & Mamajek (2016) presented a sample of 493 low-mass stars in the mass range 0.7 M° < M* < 1.3 M°, which they classified as “likely members” of the Sco-Cen association based upon the criteria lithium absorption, dwarf or subgiant surface gravities, kinematic distances, and HRD positions consistent with Sco-Cen membership (see Table 7 in Pecaut & Mamajek 2016) as well as a list of 180 stars that they rejected as likely members because one or more of the membership criteria were violated (see Table 8 in Pecaut & Mamajek 2016). In this context, however, we note that the input sample selection was based upon the existence of RASS sources at a distance of 40″, proper motions in some defined areas, and magnitude limits 7 < J < 11; see Sect. 2 by Pecaut & Mamajek (2016) for a detailed discussion. For better comparability with our analysis, we cross-matched these sources with Gaia EDR3, focused on stars redder than BP-RP = 1, and finally obtained 471 accepted and 169 rejected members from the lists presented by Pecaut & Mamajek (2016). A cross-check with the eRASS1 X-ray sources shows that out of the 471 listed likely members, 464 are detected in the framework of eRASS1, that is, the X-ray selection yields 98.5% of the likely members proposed by Pecaut & Mamajek (2016). However, among the stars rejected by Pecaut & Mamajek (2016), we find 115 X-ray detections, that is, an eRASS1 detection rate of 68%. This is still high, but far lower than the detection rate for the likely members. This discrepancy is somewhat surprising because X-ray selection did play some role in the sample definition applied by Pecaut & Mamajek (2016). The X-ray properties of the stellar sources were not further used in the ensuing member selection process, however.
To further examine the differences between accepted and rejected members (according to Pecaut & Mamajek 2016), it is instructive to examine the proper motion diagram of these objects with Gaia data. Gaia EDR3 does not provide distances and proper motions for all of the objects listed by Pecaut & Mamajek (2016), which were therefore left out from this comparison. In Fig. 11 we present this comparison, showing the proper motion diagram for the likely and eROSITA detected (blue data points) and rejected, but eROSITA detected stars (green points). We also indicate the stars that are classified as members but were not detected (red data points) and those that were rejected as members and remain without an eROSITA detection (magenta data points). Figure 11 shows that the proper motions of the vast majority of the Pecaut & Mamajek (2016) are inside the red polygon (see Sect. 2), as expected; this will be further discussed in Sect. 5.6.3. A few of the Pecaut & Mamajek (2016) member stars are located far away from this region, however. Furthermore, a substantial fraction of the stars rejected by Pecaut & Mamajek (2016) as members (green data points in Fig. 11) because one or more of their selection criteria were violated (see Table 8 in Pecaut & Mamajek 2016) are located inside the red polygon and are detected as X-ray sources.
We finally constructed a CMD for the eROSITA detected accepted (blue data points) and rejected (red data points) members (according to Pecaut & Mamajek 2016) using the Gaia measured parallaxes, magnitudes, and colors. We show this in Fig. 12 together with the PARSEC isochrones for the ages 1, 10, and 100 Myr. Figure 12 demonstrates that the vast majority of accepted members are indeed located between the 1 and 100 Myr isochrones. For the rejected eROSITA detected members, the situation is less clear: quite a few of them are located far above the 1 Myr isochrone and can therefore not be normal stars, while the great majority of the stars inside the 1 and 100 Myr isochrones have a BP-RP color below 1.5 and probably are of spectral type between K0 and KV. In this spectral range, the Li equivalent widths measured for cluster stars are largest and the equivalent width distributions may even partially overlap. This makes the measured Li equivalent widths a less reliable indicator for Sco-Cen membership.
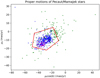 |
Fig. 11 Proper motions (in galactic coordinates) of the likely Sco-Cen association as presented in the study by Pecaut & Mamajek (2016). Blue data points refer to eRASS1 detected member, green data points to eRASS1 detected nonmembers, red data points refer to eRASS1 non-detected members, and magenta data points to eRASS1 nondetected nonmembers. The red polygon demarcates the selection region for Sco-Cen members chosen by Damiani et al. (2019) to identify Sco-Cen members. |
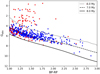 |
Fig. 12 CMD diagram of Sco-Cen members (blue data points), accepted by Pecaut & Mamajek (2016) and detected in eRASS1, as well as stars that were rejected by Pecaut & Mamajek (2016) but were also detected in eRASS1 (red data points). PARSEC isochrones (Bressan et al. 2012) for the ages 1, 10, and 100 Myr are also shown. |
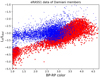 |
Fig. 13 LX/Lbol ratios for Sco-Cen members selected by Damiani et al. (2019). Blue data points refer to eRASS1 detected Sco-Cen member candidates, and red data points to X-ray upper limits. |
5.6.3 Comparison to the membership lists derived by Damiani et al. (2019)
We next compared the eROSITA detected X-ray sources in the Sco-Cen region to the membership list derived by Damiani et al. (2019) on the basis of Gaia DR2 data alone, focusing here again on the low-mass population of Sco-Cen. For the selection procedures applied by Damiani et al. (2019), we refer to Sect. 2. Specifically, Damiani et al. (2019) selected only objects as members that were located inside the red polygon displayed in Fig. 11. A cross-check reveals that a substantial fraction of the stars proposed by Damiani et al. (2019) as members is in fact detected by eROSITA, but another large fraction is not. In Fig. 13 we plot for the detected Damiani members the derived LX/Lbol ratios versus BP-RP color (blue data points in Fig. 13). For the undetected Damiani members, we can only estimate upper limits to the X-ray fluxes, which we obtained by considering the minimally detected X-ray fluxes (from more than 700 000 eRASS1 sources) as a function of ecliptic latitude to account for the changing sensitivity of the eRASS survey. Given the large size of Sco-Cen, this minimum flux varies substantially because the whole Sco-Cen complex extends from low (US) to rather high ecliptic latitudes (LCC). The upper limits computed in this fashion are plotted as red data points in Fig. 13. The figure shows that the LX/Lbol ratios of the detected members are almost exclusively at the saturation level of ~ 10−3, while the upper limit values lie well below the detection values for stars with BP-RP colors <2.5. For redder objects, detections and nondetections start to mix, and for objects with BP-RP > 3.5, only very few detections have been obtained in eRASS1. In the color range 1 < BP-RP < 2.5, some gap appears between detections and upper limits, which probably means that these nondetected stars should not be considered true Sco-Cen members. For the red stars with BP-RP > 3, we can make no real statement about the membership status of the undetected stars, but we note that with the future surveys eRASS2-eRASS8, the sensitivity will probably to increase by some factors. This leads us to expect a more or less complete detection of Sco-Cen members down to BP-RP ~ 3.5, provided that these objects exhibit saturated X-ray emission.
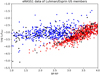 |
Fig. 14 LX/Lbol ratios for Sco-Cen members selected by Luhman & Esplin (2020). Blue data points refer to eRASS1 detected Sco-Cen accepted member candidates, and black points to detected but rejected members. Nondetections are plotted as upper limits for accepted members (red data points) and rejected members (black data points). |
5.6.4 Comparison to the membership lists derived by Luhman & Esplin (2020)
Finally, we used the US membership list derived by Luhman & Esplin (2020) to compare with to our eRASS1 data. Luhman & Esplin (2020) pursued a similar approach to that followed by Damiani et al. (2019), but that their mixture model describes the proper motion distribution statistically and not with a somewhat arbitrarily specified polygon (cf. Fig. 11). Because we are primarily interested in late-type stars, we again extracted (from Table 4 in Luhman & Esplin 2020) the stars with BP-RP > 1, but removed objects without Gaia measured parallaxes, were fainter than G = 18.4 mag, and were clearly located below the US main sequence. In this fashion, we obtained a sample of 1568 stars, 224 of which were rejected by Luhman & Esplin (2020) as members. Luhman & Esplin (2020) provided a detailed description of their selection and rejection procedure.
In the eRASS1 data we find 507 detections in the accepted Sco-Cen members (detection rate: 38%), and 108 detections in the rejected Sco-Cen members (detection rate: 48%). It appears strange that the detection rate for nonmembers is higher than that measured for members. The reason for this oddity becomes apparent from Fig. 14, where we plot eROSITA measured LX/Lbol ratios for low-mass Sco-Cen members of Luhman & Esplin (2020). Figure 14 shows that the vast majority of undetected but accepted members consists of rather red objects with BP-RP > 3, while for stars with BP-RP < 2.5, the detection rate is very high, and the derived upper limits are below the saturation level. This calls the membership status of these objects into question.
5.6.5 Assessment of kinematic membership assignment
An assessment of these results must remain ambiguous. Apparently, the extraction region chosen by Damiani et al. (2019), which according to these authors should have a field star contamination of <3%, contains quite a few stars with substantially reduced X-ray emission. This means that either we have to assume that the X-ray emission of these bona fide low-mass Sco-Cen members is not necessarily saturated, or we have to assume that the contamination in the Damiani box is higher than estimated. Verifying the rotation periods of these stars would obviously be extremely useful. We verified the properties of the membership sample derived by Pecaut & Mamajek (2016) and found that X-ray emission is indeed very common in their selected members, although X-ray emission was not used directly as a filtering criterion by Pecaut & Mamajek (2016). Many of the rejected members also show X-ray emission at comparable levels, however, and appear to be more widely distributed in the proper motion plane. Interestingly, quite a few stars rejected by Pecaut & Mamajek (2016) are located inside the Damiani box, but remain undetected by eROSITA. Finally, quite a few stars rejected by Luhman & Esplin (2020) are X-ray detected at levels comparable to the level of accepted members. In summary, it therefore appears to be unclear which criteria are best to determine the true members, but it also appears that eROSITA detected X-ray emission is a necessary but possibly not sufficient criterion.
6 Discussion and conclusions
We have presented the results of the first eROSITA all-sky survey (eRASS1) in the Sco-Cen association by cross-matching the eROSITA source catalog with Gaia EDR3. Because both Gaia and eROSITA are ongoing survey missions, our results must by necessity remain preliminary. They clearly demonstrate, however, that the combination of eROSITA X-ray data and Gaia astrometry, kinematics and photometry will eventually allow a comprehensive identification of the low-mass stellar content of the huge Sco-Cen association. This achievement will certainly form a landmark for all studies of star-forming regions. Even now we have a membership census comprising several thousand objects, and with the eROSITA and Gaia surveys completed, this number will again increase by some factors.
With these data, it is clearly of interest to consider the change in the age distribution of stars throughout the huge Sco-Cen association. Following Pecaut & Mamajek (2016), we can construct an age map of the Sco-Cen association by computing the mean (logarithmic) age of all bona fide Sco-Cen members as a function of celestial position presented in Fig. 15. Our age map was derived exclusively from low-mass stars and looks qualitatively similar to the age map presented by Pecaut & Mamajek (2016, in their Fig. 9). The mean age decreases with galactic longitude, with the youngest ages found in the US region. This result is well known. Our eROSITA maps shows blue spots, however, that is, young stars younger than 10 Myr are sprinkled almost throughout the whole Sco-Cen region. Our results therefore appear to call into question a sequential star formation in the Sco-Cen region, and no unique age can be attributed to the individual Sco-cen subgroups.
Assigning membership to stellar clusters and associations has been and still is a notoriously difficult task, and X-ray emission has so far played only a minor role in this process. While traditionally, kinematic information (kinematics led to the discovery of the Sco-Cen association in the first place) was widely used for membership assignment, the new ongoing Gaia and eROSITA missions provide high-precision CMDs and X-ray flux measurements throughout the whole Sco-Cen region. Our admittedly preliminary results demonstrate that X-ray emission must figure very importantly in the membership assigning process because eROSITA is sensitive enough to detect essentially the whole low-mass stellar population in the nearby Sco-Cen association when we make reasonable assumptions about the nature of stellar X-ray emission. We therefore argue that detected X-ray emission definitely must be a necessary criterion for membership assignment.
If we also use X-ray emission as a sufficient membership criterion, we encounter the conundrum that some of these bona fide X-ray selected members, which are cospatial with the proper Sco-Cen members, violate the usually applied kinematic membership criteria and are therefore not formal kinematic members. The percentage of this diffuse population (in velocity space) increases from US to UCL and LCC. The stars contained in this population are X-ray sources, and judging from their CMD positions, are also young, at least in their great majority (see Fig. 6), but older on average than the compact population. Furthermore, their tangential positions (see Fig. 7) are similar to those of the kinematic members, but they are displaced by about 10 km s−1 predominantly along the right ascension direction. It thus unlikely that this diffuse population has no physical connection to the compact population, but it is unclear whether we see, for example, ejected members or the relics of an older generation of stars, or if the origin of this population is unrelated to the Sco-Cen association.
It is doubtful whether the assignment of a unique age to the various Sco-Cen subgroups is a meaningful concept. While there are definite peaks in the age distribution of our bona fide Sco-Cen members, the age distributions are quite broad and may also be interpreted as the result of various episodes of star formation that are spread out in time.
A very substantial amount of optical follow-up work is clearly called for: for thousands of very likely Sco-Cen members, photometry and spectroscopy is required to determine the rotation periods of the objects, check for the presence of disks around the stars, and search for signatures of binarity. Future releases of Gaia data will provide information on binarity, and the classical tools of photometry and spectroscopy can be used to examine the Sco-Cen stars for the presence of companions. In essentially all of these objects do we expect to find lithium absorption, and it would be extremely interesting to determine the true amount of the spread in the lithium equivalent widths of these stars.
Furthermore, these stars all have chromospheres that need to be characterized. Their relation to the detected X-ray emission needs to be studied. Because all these stars show X-ray emission at the saturation level, we anticipate strong chromospheric emission that should be easily detectable, for example, in the cores of the Ca II H&K lines where only very little photo spheric emission is expected given the low photo spheric temperatures of these stars. Clearly, the young stellar population in the Sco-Cen region is likely to become a gold mine for ongoing or future large spectroscopic surveys with multi-object spectrographs such as GALAH (De Silva et al. 2015) or 4MOST (de Jong 2019).
Finally, the Sco-Cen stars provide a golden sample to search for young planetary systems. To elucidate the difference between the compact and diffuse populations, spectroscopic surveys may reveal differences between these populations. The accuracy of age assignment by CMD especially for low-mass stars also needs to be investigated. Once the complete set of eROSITA survey data are available, the expectation is that the luminosity and initial mass functions of the various Sco-Cen subgroups can be determined down to M6 and possibly further. In summary, the new data that are gathered by Gaia and eROSITA and the ensuing ground-based follow-up will therefore certainly lead to a significantly improved understanding of the star formation history in the Sco-Cen association.
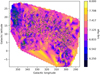 |
Fig. 15 Mean (logarithmic) age map of the whole Sco-Cen association. Blue represents younger ages, red older ages, and green dots denote the positions of late-type low-mass stars. |
Acknowledgements
This work is based on data from eROSITA, the primary instrument aboard SRG, a joint Russian-German science mission supported by the Russian Space Agency (Roskosmos), in the interests of the Russian Academy of Sciences represented by its Space Research Institute (IKI), and the Deutsches Zentrum für Luft- und Raumfahrt (DLR). The SRG spacecraft was built by Lavochkin Association (NPOL) and its subcontractors, and is operated by NPOL with support from IKI and the Max Planck Institute for Extraterrestrial Physics (MPE). The development and construction of the eROSITA X-ray instrument was led by MPE, with contributions from the Dr. Karl Remeis Observatory Bamberg and ECAP (FAU Erlangen-Nürnberg), the University of Hamburg Observatory, the Leibniz Institute for Astrophysics Potsdam (AIP), and the Institute for Astronomy and Astrophysics of the University of Tübin-gen, with the support of DLR and the Max Planck Society. The Argelander Institute for Astronomy of the University of Bonn and the Ludwig Maximilians Universität Munich also participated in the science preparation for eROSITA. The eROSITA data used for this paper were processed using the eSASS/NRTA software system developed by the German eROSITA consortium. This work has made use of data from the European Space Agency (ESA) mission Gaia (https://www.cosmos.esa.int/gaia), processed by the Gaia Data Processing and Analysis Consortium (DPAC, https://www.cosmos.esa.int/web/gaia/dpac/consortium). Funding for the DPAC has been provided by national institutions, in particular the institutions participating in the Gaia Multilateral Agreement. This research has also made use of the SIMBAD database, operated at CDS, Strasbourg, France. We acknowledge discussions with Drs. C. Bell and H. Zinnecker, which very much helped to improve this paper.
Appendix A eROSITA data for low-mass stars in the Sco-Cen association
In Tab. A.1 we present the new eROSITA data for X-ray detected low-mass stars in the Sco-Cen region. All objects shown in Fig. 6 are listed. We specifically provide the eROSITA names (in Col. 1) and the Gaia EDR3 entries (in Col. 2) with which the X-ray sources are associated. Columns 3 and 4 provide the eROSITA X-ray coordinates (α and δ in degrees), and Col. 5 contains the distance (in arcsec) between X-ray and Gaia position. Column 6 gives the eRASS1 count rate, Col. 7 the probability for the correctness of the association between X-ray and optical source, and the flag in Col. 8 indicates the subregion in which the respective source is located. We point out that these results are derived from SASS processing 946, which is not the final version of the X-ray data. The printed table only lists some exemplary entries sorted by decreasing measured count rate. The table in its entirety is available electronically at the CDS.
While a detailed comparison of the 6190 X-ray sources listed in Tab. A.1, for example, with the SIMBAD data base, is far beyond the scope of this paper, it is of interest to investiagte the very brightest sources as a sanity check of our identification scheme: The brightest source (1eRASS J113929.2-652348) is the RS CVn type variable 12 Mus (g = 4.9), and the second brightest source (1eRASS J160901.8-390512) is the source V908 Sco (g = 13.6, spectral type M5.5), a classical T Tauri star in the Lupus SFR (Galli et al. 2013), which remained undetected in the ROSAT all-sky survey. Its high eRASS1 X-ray flux is quite puzzling. The third brightest source (1eRASS J134401.1-612157) is the well-known RS CVn system V851 Cen (g = 7.4). The fourth brightest source (1eRASS J121733.6-675739) is ∈ Mus (g = 2.7). This detection is entirely due to optical contamination, a topic addressed in Sec. B.1. The eighth brightest source source (1eRASS J160538.0-203947) is again an active M star (g = 11.9, spectral type M0) that was not detected in the ROSAT all-sky survey. This shows that while it might naively be assumed that the brightest stellar eROSITA sources are all contained in the ROSAT all-sky survey, this is not the case due to the large variability of the X-ray sky. As a consequence, it is also clear that a study similar to the one presented here but with any of the subsequent eRASS surveys is likely to yield a substantial number of late-type low-mass Sco-Cen members that are not contained in Tab. A.1.
Basic X-ray properties of the sample stars; columns 1 and 2 list the eROSITA and Gaia EDR3 names, columns 3 and 4 give the X-ray positions, column 5 the offset between X-ray and optical position, column 6 the measured eRASS1 count rate, columns 7 the association probability and column 8 is a flag indicating the subgroup the object belongs to.
Appendix B Optical contamination
The eROSITA detectors are prone to optical contamination. Optical photons also lead to the creation of charges in the CCD pixels of the detectors, and for an optically brighter source, the charge deposited in this way during the accumulation time of 50 ms can be as large as that deposited by an actual X-ray photon. In this way, optical photons can produce false X-ray photons. For a pointing observatory such as XMM-Newton, it is therefore possible to choose blocking filters of various thicknesses depending on the expected optical brightness of the X-ray sources. For a scanning mission such as eROSITA, this is not feasible, and the optical contamination is unavoidable. To illustrate the effects of optical contamination, we plot in Fig. B.1 the recorded X-ray count rate as a function of apparent g magnitude for all stars listed in Tab. A.1. For the brighter stars one notices a “cutoff” in the sense that at a given optical apparent magnitude a minimal count rate exists, indicated by the dotted black line in Fig. refoptcont; at the bright end lies the source ∈ Mus, discussed in Sec. A. All sources located in the vicinity of the black line in the diagram of the count rate versus apparent magnitude need to be treated with extreme caution because they are very likely due to optical contamination and not to true X-ray flux. Fig. B.1 also shows that for the vast bulk of the sources reported in this paper, optical contamination is not an issue, however.
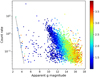 |
Fig. B.1 eROSITA count rate vs. apparent g magnitude for all stars listed in Tab. A.1. The color-coding reflects the BP-RP color of the respective objects, and the dotted black line indicates the level of optical contamination. Stars located close to this line may be substantially optically contaminated. See text for more details. |
References
- Andrae, R., Fouesneau, M., Creevey, O., et al. 2018, A&A, 616, A8 [NASA ADS] [CrossRef] [EDP Sciences] [Google Scholar]
- Ayres, T. R. 2018, AJ, 156, 163 [NASA ADS] [CrossRef] [Google Scholar]
- Blaauw, A. 1946, PhD thesis, Kapteyn Astronomical Laboratory Groningen, The Netherlands [Google Scholar]
- Bouvier, J., Matt, S. P., Mohanty, S., et al. 2014, in Protostars and Planets VI, eds. H. Beuther, R. S. Klessen, C. P. Dullemond, & T. Henning (Tucson: University of Arizona Press), 433 [Google Scholar]
- Bressan, A., Marigo, P., Girardi, L., et al. 2012, MNRAS, 427, 127 [NASA ADS] [CrossRef] [Google Scholar]
- Bressert, E., Bastian, N., Gutermuth, R., et al. 2010, MNRAS, 409, L54 [NASA ADS] [Google Scholar]
- Brunner, H., Liu, T., Lamer, G., et al. 2022, A&A, 661, A1 (eROSITA EDR SI) [NASA ADS] [CrossRef] [EDP Sciences] [Google Scholar]
- Damiani, F., Prisinzano, L., Pillitteri, I., Micela, G., & Sciortino, S. 2019, A&A, 623, A112 [NASA ADS] [CrossRef] [EDP Sciences] [Google Scholar]
- de Jong, R. S. 2019, Nat. Astron., 3, 574 [NASA ADS] [CrossRef] [Google Scholar]
- De Silva, G. M., Freeman, K. C., Bland-Hawthorn, J., et al. 2015, MNRAS, 449, 2604 [NASA ADS] [CrossRef] [Google Scholar]
- de Zeeuw, P. T., Hoogerwerf, R., de Bruijne, J. H. J., Brown, A. G. A., & Blaauw, A. 1999, AJ, 117, 354 [Google Scholar]
- Dobbie, P. D., Lodieu, N., & Sharp, R. G. 2010, MNRAS, 409, 1002 [Google Scholar]
- Fernández, D., Figueras, F., & Torra, J. 2008, A&A, 480, 735 [NASA ADS] [CrossRef] [EDP Sciences] [Google Scholar]
- Gaia Collaboration (Prusti, T., et al.) 2016, A&A, 595, A1 [NASA ADS] [CrossRef] [EDP Sciences] [Google Scholar]
- Gaia Collaboration (Babusiaux, C., et al.) 2018, A&A, 616, A10 [NASA ADS] [CrossRef] [EDP Sciences] [Google Scholar]
- Galli, P. A. B., Bertout, C., Teixeira, R., & Ducourant, C. 2013, A&A, 558, A77 [NASA ADS] [CrossRef] [EDP Sciences] [Google Scholar]
- Hoogerwerf, R., de Bruijne, J. H. J., & de Zeeuw, P. T. 2001, A&A, 365, 49 [NASA ADS] [CrossRef] [EDP Sciences] [Google Scholar]
- Huensch, M., Reimers, D., & Schmitt, J. H. M. M. 1996, A&A, 313, 755 [NASA ADS] [Google Scholar]
- Johnson, D. R. H., & Soderblom, D. R. 1987, AJ, 93, 864 [Google Scholar]
- Johnstone, C. P., Güdel, M., Brott, I., & Lüftinger, T. 2015, A&A, 577, A28 [NASA ADS] [CrossRef] [EDP Sciences] [Google Scholar]
- Kapteyn, J. C. 1914, ApJ, 40, 43 [NASA ADS] [CrossRef] [Google Scholar]
- Karim, M. T., & Mamajek, E. E. 2017, MNRAS, 465, 472 [Google Scholar]
- Kroupa, P., Weidner, C., Pflamm-Altenburg, J., et al. 2013, The Stellar and SubStellar Initial Mass Function of Simple and Composite Populations, eds. T. D. Oswalt, & G. Gilmore (Dordrecht, The Netherlands: Springer), 5, 115 [NASA ADS] [Google Scholar]
- Kuerster, M., & Schmitt, J. H. M. M. 1996, A&A, 311, 211 [Google Scholar]
- Landin, N. R., Mendes, L. T. S., & Vaz, L. P. R. 2010, A&A, 510, A46 [NASA ADS] [CrossRef] [EDP Sciences] [Google Scholar]
- Luhman, K. L., & Esplin, T. L. 2020, AJ, 160, 44 [Google Scholar]
- Merloni, A., Predehl, P., Becker, W., et al. 2012, ArXiv e-prints [arXiv:1209.3114] [Google Scholar]
- Pecaut, M. J., & Mamajek, E. E. 2013, ApJS, 208, 9 [Google Scholar]
- Pecaut, M. J., & Mamajek, E. E. 2016, MNRAS, 461, 794 [Google Scholar]
- Predehl, P., Andritschke, R., Arefiev, V., et al. 2021, A&A, 647, A1 [EDP Sciences] [Google Scholar]
- Preibisch, T., & Mamajek, E. 2008, Handbook of Star Forming Regions, The Nearest OB Association: Scorpius-Centaurus (Sco OB2), ed. B. Reipurth (USA: ASP Monograph), 5, 235 [Google Scholar]
- Preibisch, T., & Zinnecker, H. 1999, AJ, 117, 2381 [NASA ADS] [CrossRef] [Google Scholar]
- Preibisch, T., Guenther, E., Zinnecker, H., et al. 1998, A&A, 333, 619 [NASA ADS] [Google Scholar]
- Preibisch, T., Brown, A. G. A., Bridges, T., Guenther, E., & Zinnecker, H. 2002, AJ, 124, 404 [NASA ADS] [CrossRef] [Google Scholar]
- Rizzuto, A. C., Ireland, M. J., & Robertson, J. G. 2011, MNRAS, 416, 3108 [Google Scholar]
- Rizzuto, A. C., Ireland, M. J., & Kraus, A. L. 2015, MNRAS, 448, 2737 [NASA ADS] [CrossRef] [Google Scholar]
- Röser, S., Schilbach, E., Goldman, B., et al. 2018, A&A, 614, A81 [NASA ADS] [CrossRef] [EDP Sciences] [Google Scholar]
- Schmitt, J. H. M. M. 1997, A&A, 318, 215 [NASA ADS] [Google Scholar]
- Schneider, P. C., Freund, S., Czesla, S., et al. 2022, A&A, 661, A6 (eROSITA EDR SI) [NASA ADS] [CrossRef] [EDP Sciences] [Google Scholar]
- Silaj, J., & Landstreet, J. D. 2014, A&A, 566, A132 [NASA ADS] [CrossRef] [EDP Sciences] [Google Scholar]
- Stauffer, J. R., Hartmann, L. W., Prosser, C. F., et al. 1997, ApJ, 479, 776 [NASA ADS] [CrossRef] [Google Scholar]
- Wright, N. J., Drake, J. J., Mamajek, E. E., & Henry, G. W. 2011, ApJ, 743, 48 [Google Scholar]
All Tables
Basic X-ray properties of the sample stars; columns 1 and 2 list the eROSITA and Gaia EDR3 names, columns 3 and 4 give the X-ray positions, column 5 the offset between X-ray and optical position, column 6 the measured eRASS1 count rate, columns 7 the association probability and column 8 is a flag indicating the subgroup the object belongs to.
All Figures
|
Fig. 1 X-ray flux for a saturated coronal source at a distance of 120 pc vs. effective temperature (red data points) and apparent Gaia G magnitude for the same objects (blue data points). The dash-dotted lines refer (from top to bottom) to limiting flux levels for the ROSAT all-sky survey, the minimum eROSITA all-sky survey, and to a hypothetical limiting eROSITA flux at high ecliptic latitudes. See text for details. |
| In the text | |
|
Fig. 2 Histogram of position deviations (in arcsec) between eRASS1 and Gaia EDR3 positions for bona fide US members (blue histogram), UCL members (red histogram), and LCC members (green histogram). |
| In the text | |
|
Fig. 3 Histogram of normalized position deviations (dimensionless) between eRASS1 and Gaia EDR3 positions for bona fide Sco-Cen members (blue data points) and Rayleigh distribution (red curve). |
| In the text | |
|
Fig. 4 eRASSl X-ray sources in the fourth galactic quadrant between −10° < b < 30°. The nominal regions of the Sco-Cen subgroups as defined by Preibisch & Mamajek (2008) are indicated. The colored sources indicates the sources identified with Gaia stars in the distance range 60–200 pc. Blue sources indicate US member candidates, red sources show UCC member candidates, and green sources represent LCC member candidates. Typical eRASS1 position errors are 4 arcsec. |
| In the text | |
|
Fig. 5 3D view of detected eRASS1 stellar X-ray sources in the fourth galactic quadrant in the (X,Y,Z) coordinate system. For orientation, some individual objects or regions in the Sco-Cen association are indicated. See text for details. |
| In the text | |
|
Fig. 6 Color-magnitude diagram of low-mass stellar X-ray sources in the US (blue data points), UCL (red data points), and LCC (green data points) regions together with PARSEC isochrones (Bressan et al. 2012). The photometry errors are very small. Parallax errors are typically at the percent level with large variations. |
| In the text | |
|
Fig. 7 Tangential velocities of low-mass stellar X-ray sources in the US (blue data points), UCL (red data points), and LCC (green data points) regions. The majority of the population is contained in the plotted ellipses, but a population exists that is rather diffuse in velocity space. See text for details. |
| In the text | |
|
Fig. 8 Volume density of young stars (in units of objects per pc3) for the kinematic UCL members (red data points) and cospatial but kinematic nonmembers (blue data points). |
| In the text | |
|
Fig. 9 LX/Lbol vs. BP-RP color for low-mass kinematic member X-ray sources in the US (blue crosses), UCL (red crosses), and LCC (green crosses) regions as well as low-mass kinematic nonmembers drawn as pluses with the same color code. The saturation limit for stars with BP-RP > 1.5 is well developed in both populations. |
| In the text | |
|
Fig. 10 Age distribution histogram for low-mass kinematic member X-ray sources in the US (blue histograms), UCL (red histograms), and LCC (green histograms) regions. The solid histograms describe the compact population, and the dashed histograms the diffuse populations. See text for details. |
| In the text | |
|
Fig. 11 Proper motions (in galactic coordinates) of the likely Sco-Cen association as presented in the study by Pecaut & Mamajek (2016). Blue data points refer to eRASS1 detected member, green data points to eRASS1 detected nonmembers, red data points refer to eRASS1 non-detected members, and magenta data points to eRASS1 nondetected nonmembers. The red polygon demarcates the selection region for Sco-Cen members chosen by Damiani et al. (2019) to identify Sco-Cen members. |
| In the text | |
|
Fig. 12 CMD diagram of Sco-Cen members (blue data points), accepted by Pecaut & Mamajek (2016) and detected in eRASS1, as well as stars that were rejected by Pecaut & Mamajek (2016) but were also detected in eRASS1 (red data points). PARSEC isochrones (Bressan et al. 2012) for the ages 1, 10, and 100 Myr are also shown. |
| In the text | |
|
Fig. 13 LX/Lbol ratios for Sco-Cen members selected by Damiani et al. (2019). Blue data points refer to eRASS1 detected Sco-Cen member candidates, and red data points to X-ray upper limits. |
| In the text | |
|
Fig. 14 LX/Lbol ratios for Sco-Cen members selected by Luhman & Esplin (2020). Blue data points refer to eRASS1 detected Sco-Cen accepted member candidates, and black points to detected but rejected members. Nondetections are plotted as upper limits for accepted members (red data points) and rejected members (black data points). |
| In the text | |
|
Fig. 15 Mean (logarithmic) age map of the whole Sco-Cen association. Blue represents younger ages, red older ages, and green dots denote the positions of late-type low-mass stars. |
| In the text | |
|
Fig. B.1 eROSITA count rate vs. apparent g magnitude for all stars listed in Tab. A.1. The color-coding reflects the BP-RP color of the respective objects, and the dotted black line indicates the level of optical contamination. Stars located close to this line may be substantially optically contaminated. See text for more details. |
| In the text | |
Current usage metrics show cumulative count of Article Views (full-text article views including HTML views, PDF and ePub downloads, according to the available data) and Abstracts Views on Vision4Press platform.
Data correspond to usage on the plateform after 2015. The current usage metrics is available 48-96 hours after online publication and is updated daily on week days.
Initial download of the metrics may take a while.