Fig. 1
Download original image
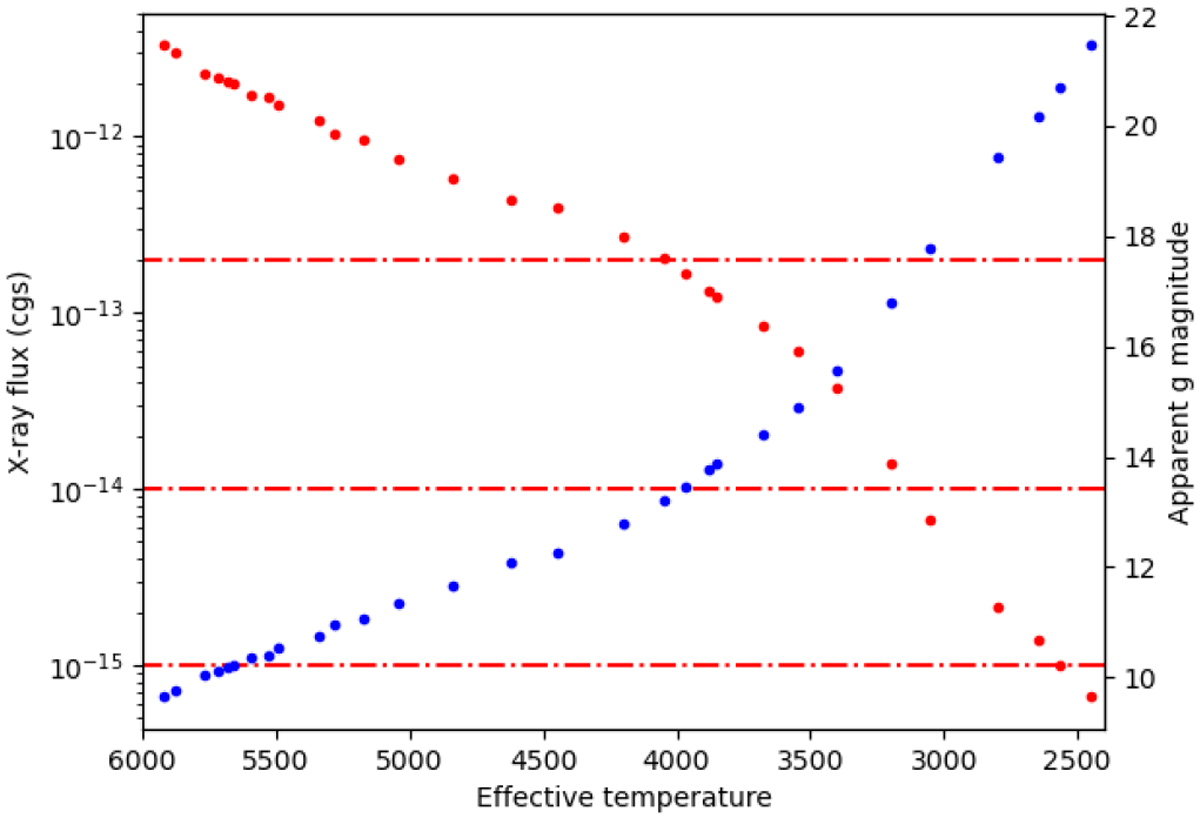
X-ray flux for a saturated coronal source at a distance of 120 pc vs. effective temperature (red data points) and apparent Gaia G magnitude for the same objects (blue data points). The dash-dotted lines refer (from top to bottom) to limiting flux levels for the ROSAT all-sky survey, the minimum eROSITA all-sky survey, and to a hypothetical limiting eROSITA flux at high ecliptic latitudes. See text for details.
Current usage metrics show cumulative count of Article Views (full-text article views including HTML views, PDF and ePub downloads, according to the available data) and Abstracts Views on Vision4Press platform.
Data correspond to usage on the plateform after 2015. The current usage metrics is available 48-96 hours after online publication and is updated daily on week days.
Initial download of the metrics may take a while.