Fig. 15
Download original image
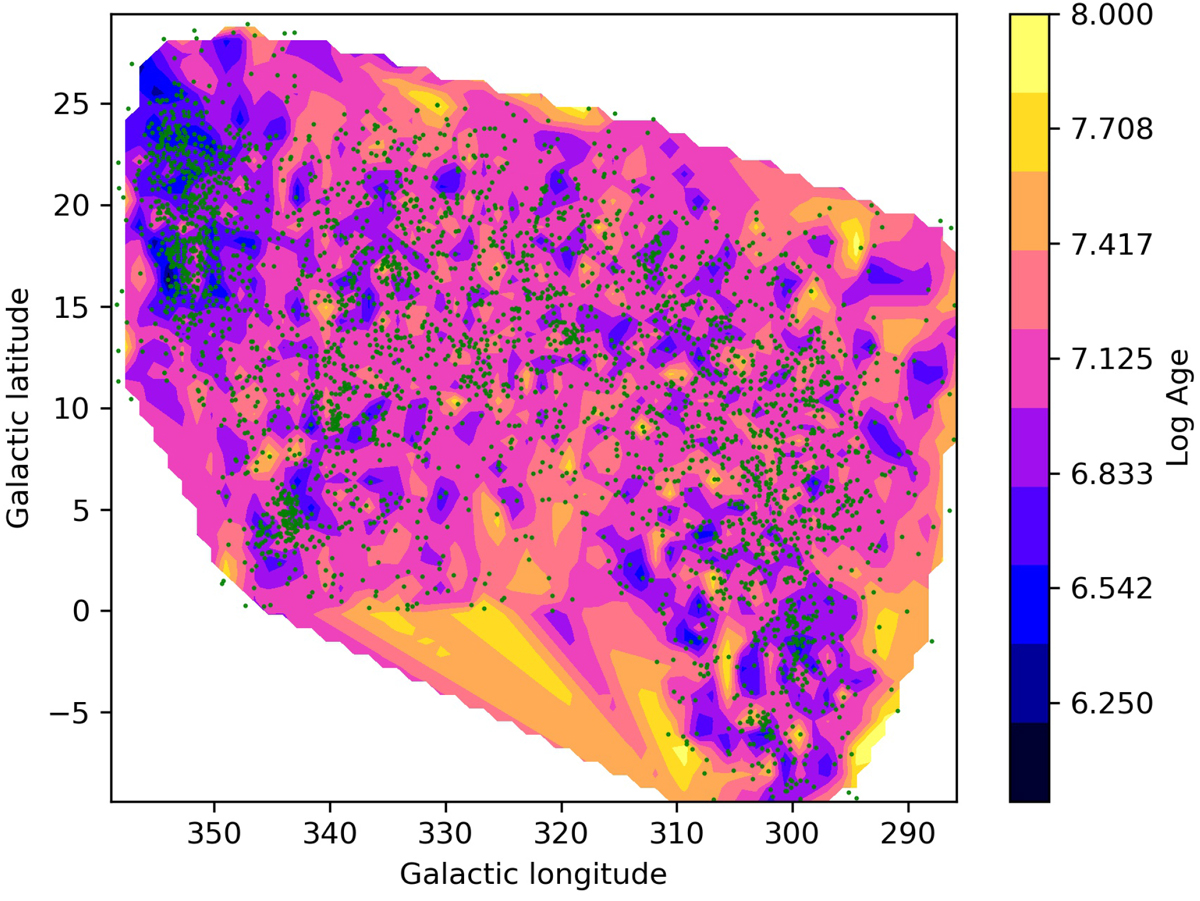
Mean (logarithmic) age map of the whole Sco-Cen association. Blue represents younger ages, red older ages, and green dots denote the positions of late-type low-mass stars.
Current usage metrics show cumulative count of Article Views (full-text article views including HTML views, PDF and ePub downloads, according to the available data) and Abstracts Views on Vision4Press platform.
Data correspond to usage on the plateform after 2015. The current usage metrics is available 48-96 hours after online publication and is updated daily on week days.
Initial download of the metrics may take a while.