Fig. 7
Download original image
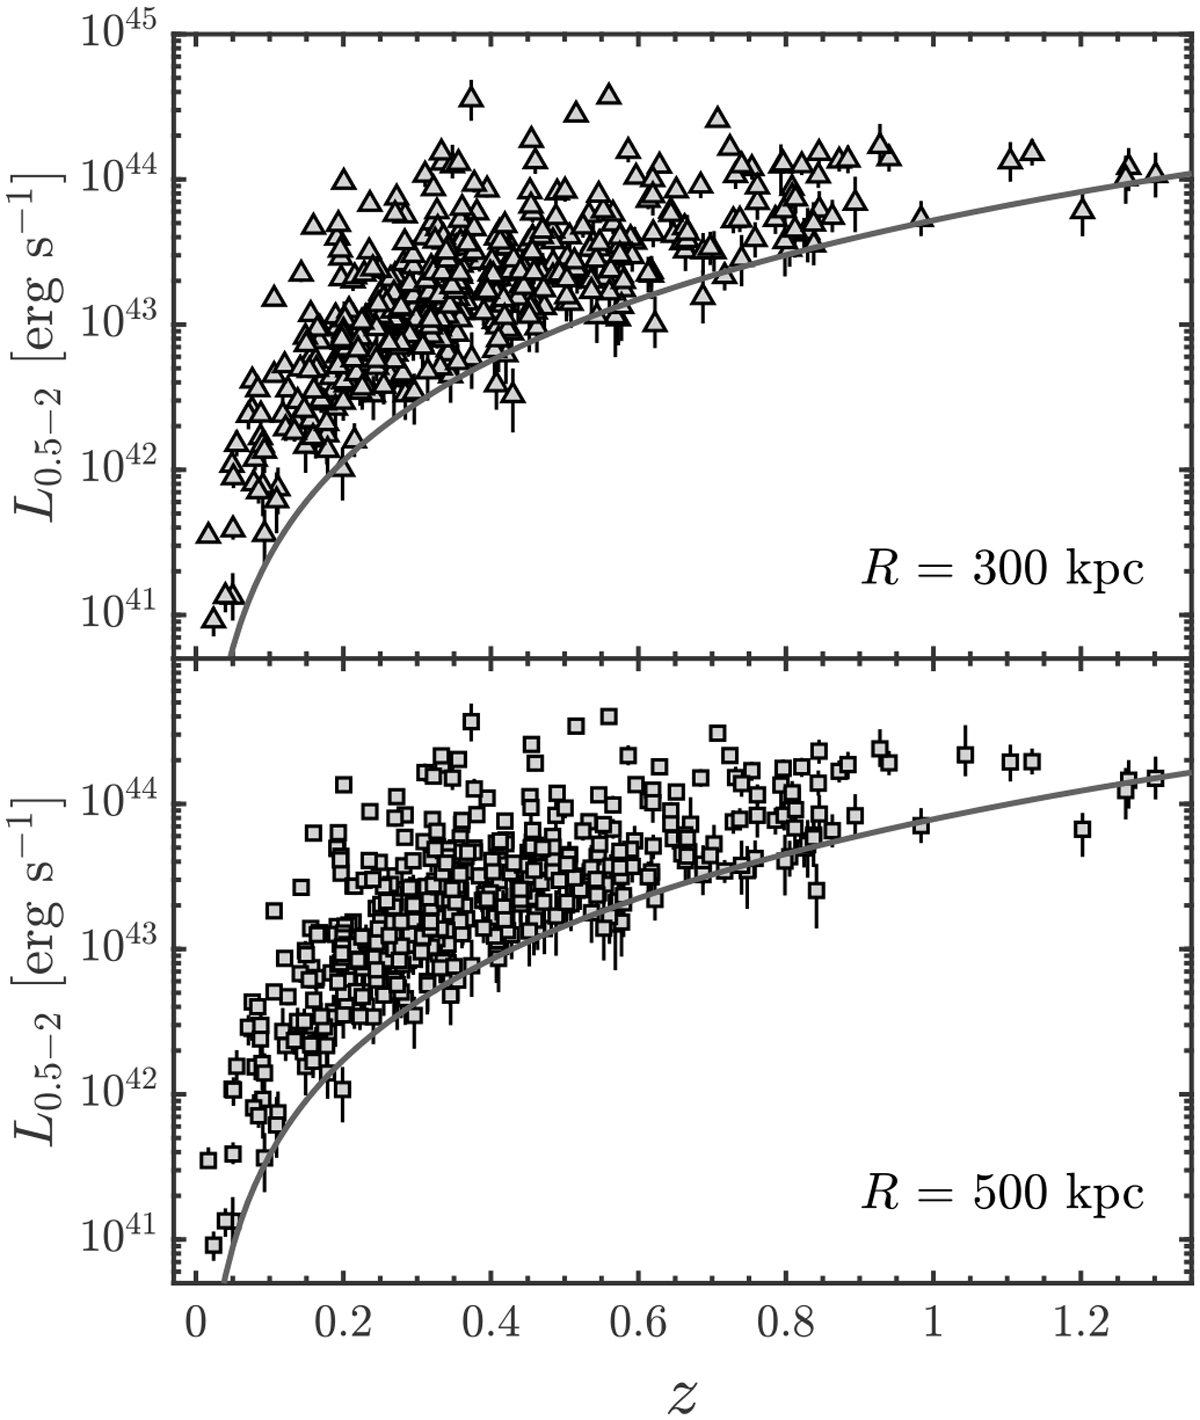
Luminosity redshift distribution of the clusters with significant luminosity measurements (>2σ) for 300 kpc (upperpanel) and 500 kpc (lower panel). The black curve shows the flux limit: 10–14 erg s–1 cm–2 for 300 kpc and 1.5 × 10⁻¹⁴ erg s–1 cm–2 for 500 kpc (without a K correction).
Current usage metrics show cumulative count of Article Views (full-text article views including HTML views, PDF and ePub downloads, according to the available data) and Abstracts Views on Vision4Press platform.
Data correspond to usage on the plateform after 2015. The current usage metrics is available 48-96 hours after online publication and is updated daily on week days.
Initial download of the metrics may take a while.