Fig. 5
Download original image
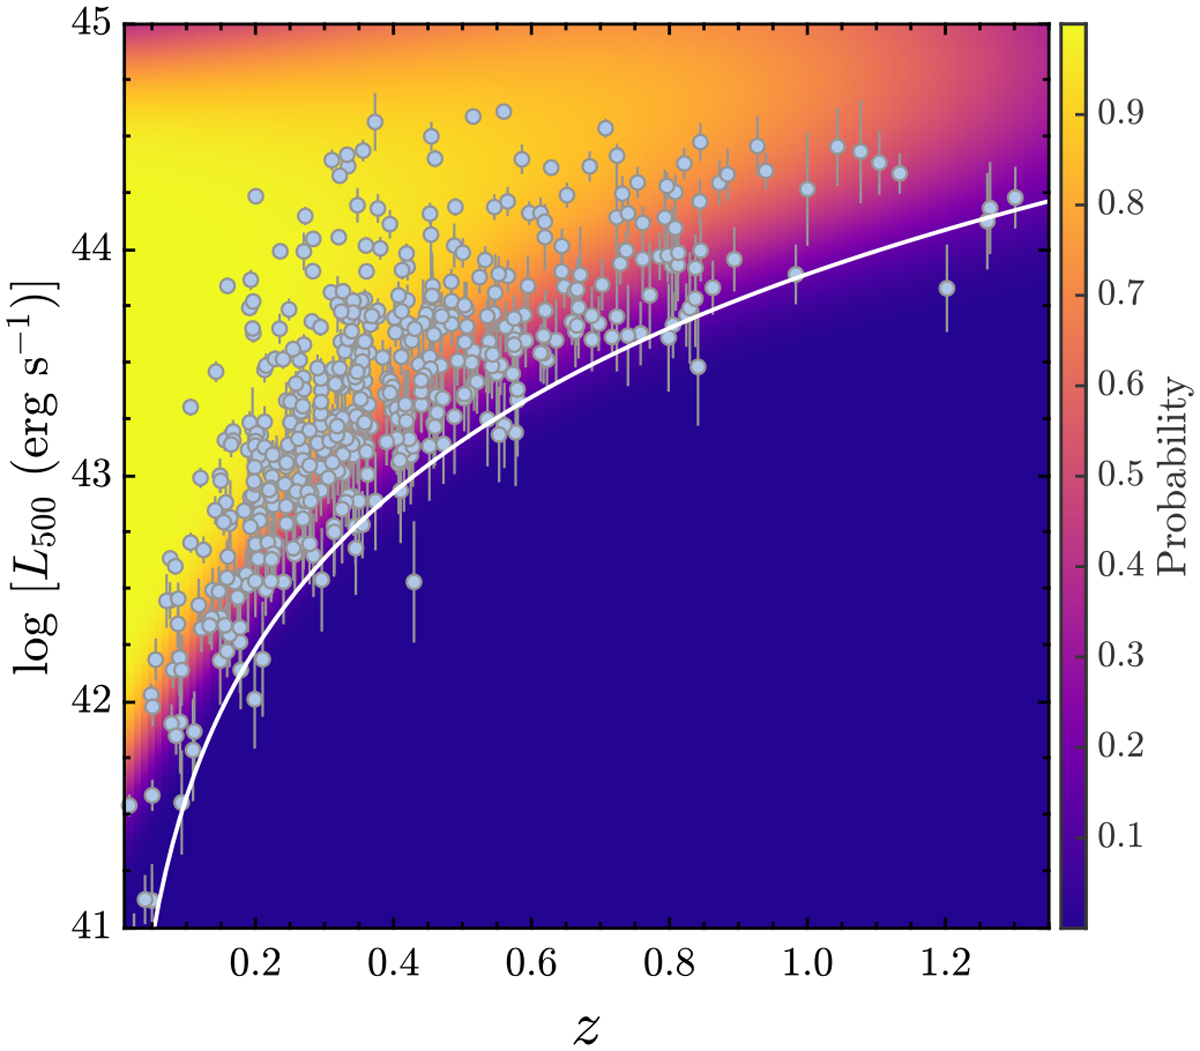
Detection probability as a function of luminosity L500 in the 0.5–2 keV band and redshift ɀ. The data points with error bars are the L500 for the clusters with >2σ measurements. Details of the computation of L500 are presented in Sect. 5. The white curve shows the flux limit at 1.5 × 10⁻¹⁴ erg s–1 cm–2, corresponding to an average completeness level of ~40%.
Current usage metrics show cumulative count of Article Views (full-text article views including HTML views, PDF and ePub downloads, according to the available data) and Abstracts Views on Vision4Press platform.
Data correspond to usage on the plateform after 2015. The current usage metrics is available 48-96 hours after online publication and is updated daily on week days.
Initial download of the metrics may take a while.