Fig. 2
Download original image
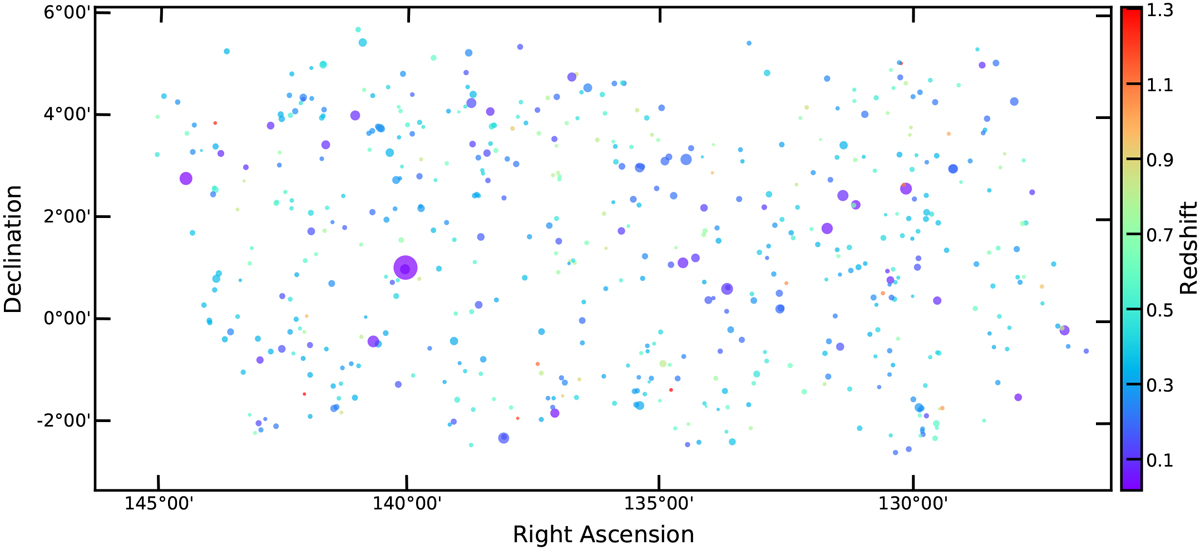
Distribution of the 542 cluster candidates in eFEDS. The color code represents the redshift of the cluster, provided by MCMF (Klein et al. 2018, 2019). The radius of the circle is equal to R500, within which the average density is 500 times the critical density at the cluster redshift.
Current usage metrics show cumulative count of Article Views (full-text article views including HTML views, PDF and ePub downloads, according to the available data) and Abstracts Views on Vision4Press platform.
Data correspond to usage on the plateform after 2015. The current usage metrics is available 48-96 hours after online publication and is updated daily on week days.
Initial download of the metrics may take a while.