Fig. A.1
Download original image
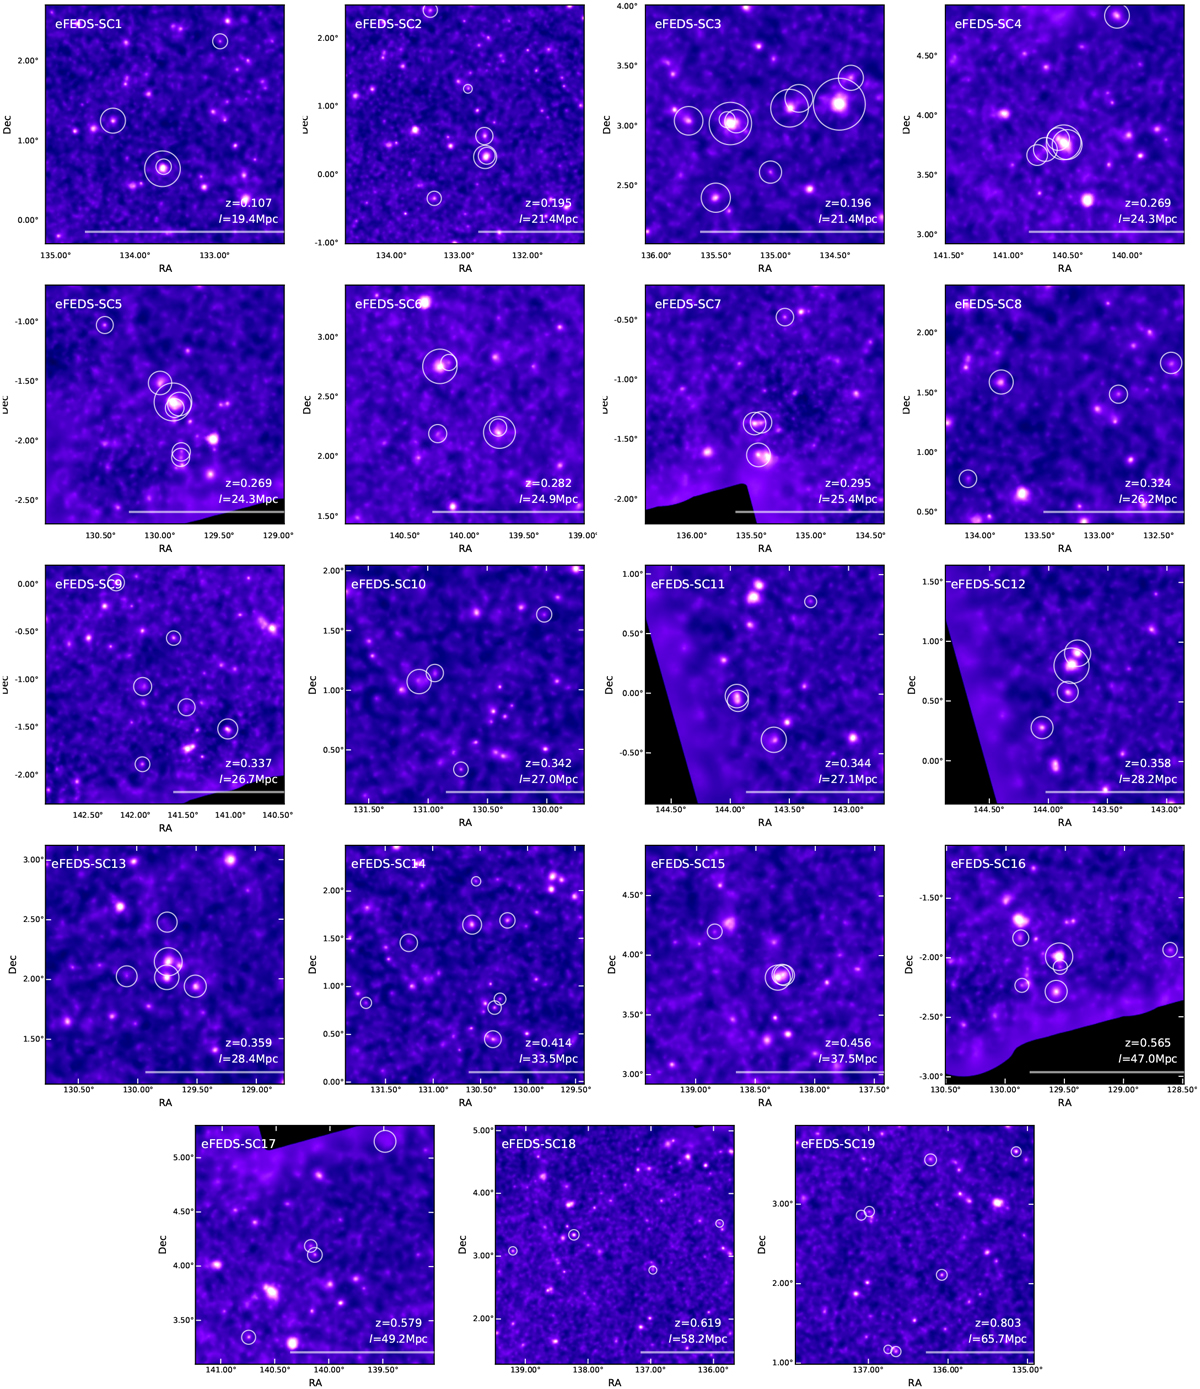
X-ray images of the 19 superclusters we detected in the eFEDS field. The images are generated in the same way as for Fig. 1. The white circles mark the estimated virial radii of the member clusters of each supercluster. The thick bar in the lower right corner indicates the linking length at the supercluster redshift.
Current usage metrics show cumulative count of Article Views (full-text article views including HTML views, PDF and ePub downloads, according to the available data) and Abstracts Views on Vision4Press platform.
Data correspond to usage on the plateform after 2015. The current usage metrics is available 48-96 hours after online publication and is updated daily on week days.
Initial download of the metrics may take a while.