Fig. 3
Download original image
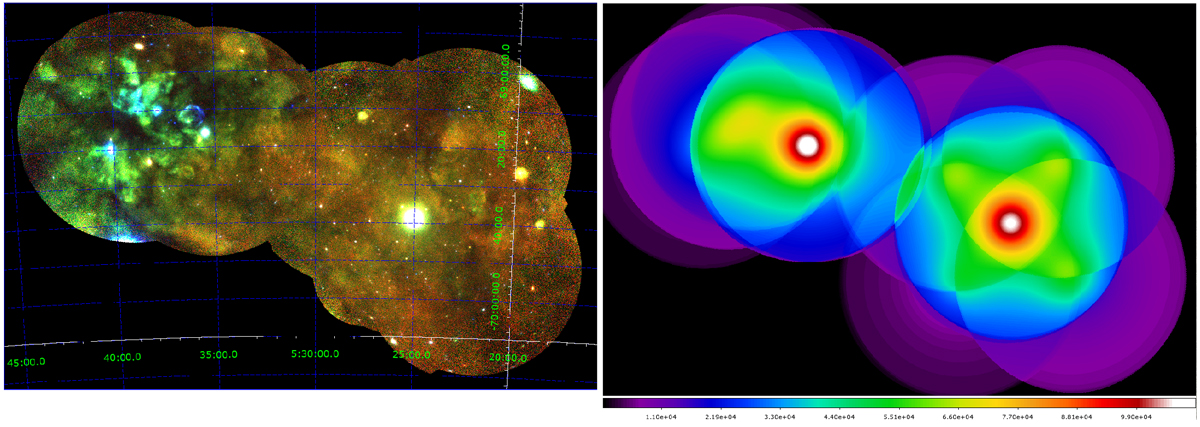
Exposure-corrected mosaic image of the SN 1987A and SNR N132D regions (left) in three-colour presentation (red: 0.2−0.5 keV, green = 0.5−1.0 keV, blue = 1.0−2.0 keV) and a mosaic of exposure maps of all observations (right) in the entire energy range of 0.2−10.0 keV shown in linear scale in the range of 0−110 ks.
Current usage metrics show cumulative count of Article Views (full-text article views including HTML views, PDF and ePub downloads, according to the available data) and Abstracts Views on Vision4Press platform.
Data correspond to usage on the plateform after 2015. The current usage metrics is available 48-96 hours after online publication and is updated daily on week days.
Initial download of the metrics may take a while.