Fig. 13
Download original image
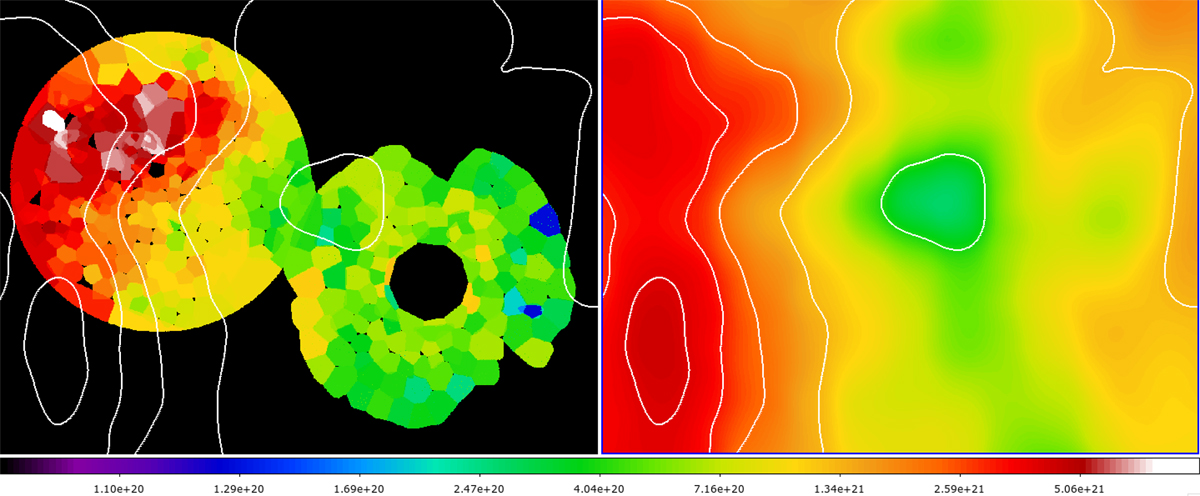
NH,LMC in the LMC obtained from the fit of the eROSITA spectra (left) vs. NH.cold,LMC directly calculated from cold H I and dust (right) in cm–2. Both images are shown in log-scale using the same lower and upper cuts. The contours of NH,cold,LMC are plotted in both panels.
Current usage metrics show cumulative count of Article Views (full-text article views including HTML views, PDF and ePub downloads, according to the available data) and Abstracts Views on Vision4Press platform.
Data correspond to usage on the plateform after 2015. The current usage metrics is available 48-96 hours after online publication and is updated daily on week days.
Initial download of the metrics may take a while.