Fig. 11
Download original image
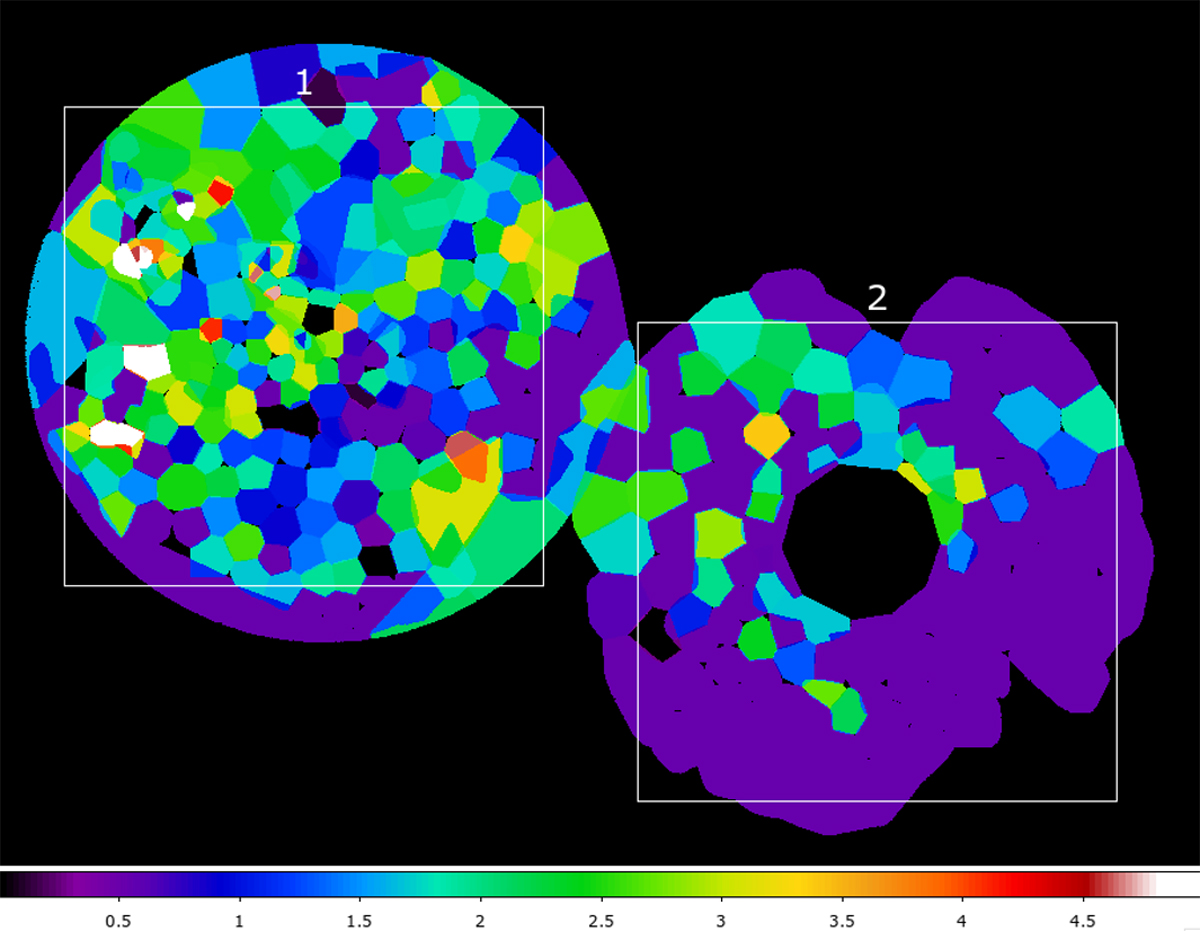
Parameter map of fitted Ne abundances (normalised to solar abundance). The white boxes are the regions used for the calculation of the star formation rate (Fig. 12).
Current usage metrics show cumulative count of Article Views (full-text article views including HTML views, PDF and ePub downloads, according to the available data) and Abstracts Views on Vision4Press platform.
Data correspond to usage on the plateform after 2015. The current usage metrics is available 48-96 hours after online publication and is updated daily on week days.
Initial download of the metrics may take a while.