Fig. 10
Download original image
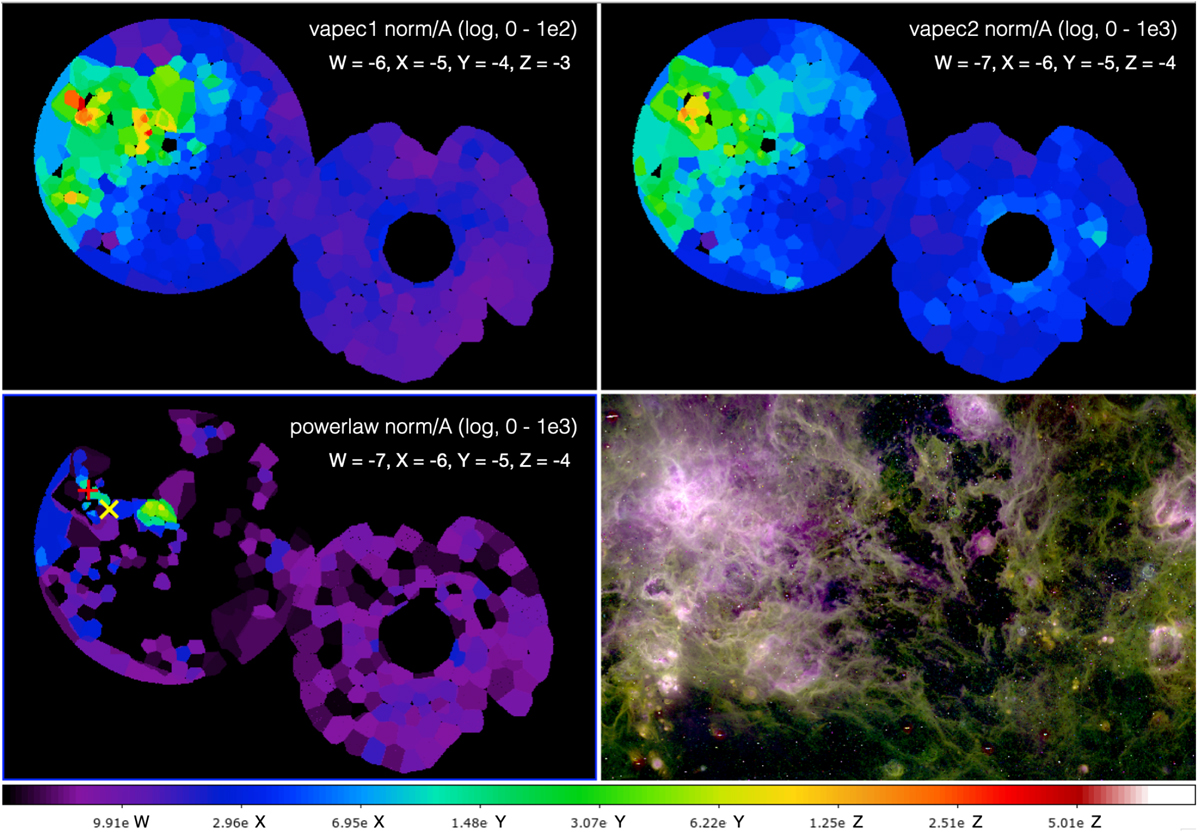
Parameter maps of the normalisation per arcmin2, illustrating the surface brightness of the diffuse emission, for the two thermal components (vapec1, vapec2) and the powerlaw component. The images are shown in log-scale. The letters W, X, Y, Z in the labels correspond to the exponents of the marks of the colour scale. The red plus sign indicates the position of the star cluster RMC 136,the yellow cross that of SNR/PWN N157B. The lower right panel shows Hα (red), [S II] (green), and [O III] (blue) images of MCELS in three-colour presentation.
Current usage metrics show cumulative count of Article Views (full-text article views including HTML views, PDF and ePub downloads, according to the available data) and Abstracts Views on Vision4Press platform.
Data correspond to usage on the plateform after 2015. The current usage metrics is available 48-96 hours after online publication and is updated daily on week days.
Initial download of the metrics may take a while.