| Issue |
A&A
Volume 660, April 2022
|
|
|---|---|---|
| Article Number | A3 | |
| Number of page(s) | 7 | |
| Section | The Sun and the Heliosphere | |
| DOI | https://doi.org/10.1051/0004-6361/202142285 | |
| Published online | 30 March 2022 | |
Anisotropic nonthermal motions in the transition region of solar active regions
1
Department of Mathematics and Statistics, Shandong University, Weihai 264209, PR China
2
Max-Planck-Institut für Sonnensystemforschung, Justus-von-Liebig-Weg 3, 37077 Göttingen, Germany
3
Shandong Provincial Key Laboratory of Optical Astronomy and Solar-Terrestrial Environment, Institute of Space Sciences, Shandong University, Weihai 264209, PR China
e-mail: This email address is being protected from spambots. You need JavaScript enabled to view it.
Received:
23
September
2021
Accepted:
20
January
2022
Abstract
Context. We study the nonthermal motions in the transition region of active regions (ARs) using center-to-limb observations of Si IV 1394 Å and 1403 Å lines.
Aims. The aim of this study is to investigate the characteristics of nonthermal motions in the transition region of ARs using the center-to-limb measurement.
Methods. We used Interface Region Imaging Spectrograph (IRIS) observations of the Si IV doublet lines 1393.78 Å and 1402.77 Å from the transition region of ARs to analyze nonthermal motions. We compared our analyzed data to similar data for the quiet Sun (QS) regions. We derive the nonthermal width by performing a single Gaussian fitting on the average spectral line profiles of Si IV doublet lines. We carried out a statistical analysis of the nonthermal width using the center-to-limb measurement.
Results. We find that the nonthermal motions are clearly decreasing on the disk with increasing distance from disk center. Only close to the limb, clearly beyond μ = 0.4, does the nonthermal broadening increase again towards the limb. The decrease in the nonthermal broadening in ARs away from disk center is markedly different from what is seen in the QS.
Conclusions. We conclude that nonthermal motions are anisotropic in ARs, with the vertical component being greater than the horizontal one. In contrast, we find the situation in the QS to be consistent with the findings of previous studies; only opacity effects are responsible for the increase in the nonthermal widths towards the limb, and nonthermal motions are isotropic in the QS.
Key words: methods: observational / Sun: atmosphere / Sun: transition region / Sun: UV radiation
© ESO 2022
1. Introduction
Active regions (ARs) are areas where the strongest magnetic concentrations and extreme UV and X-ray emission are found, demonstrating where the most significant heating occurs. ARs are also the major source of various solar activity phenomena (van Driel-Gesztelyi & Green 2015), including flares (Benz 2017) and coronal mass ejections (Webb & Howard 2012). Plasma motions in these AR phenomena are closely associated with the dynamics of heating processes.
Spectral lines from solar observations, especially in the transition region and corona, present nonthermal broadening of their line profiles beyond the expected thermal and instrumental broadening. Early observations have already found the remarkable nonthermal broadening of emission lines from the chromosphere–corona transition zone (Boland et al. 1973, 1975; Feldman & Behring 1974; Doschek et al. 1975; Feldman et al. 1976; Doschek & Feldman 1977). The excess width of the observed line profile, namely the nonthermal width, is proof of the existence of the nonthermal motions that are generally spatially unresolved by observations. De Pontieu et al. (2015) found that the nonthermal width is invariant with changing spatial resolution by comparing the much improved spatial resolution (0.33″) of interface region imaging spectrograph (IRIS, De Pontieu et al. 2014) to those of previous spectrographs (2″), implying that the processes causing the broadening occur on spatial scales smaller than 250 km.
It is observed that the nonthermal width of the line profile differs in distinct regions of the corona. In the quiet Sun (QS), Chae et al. (1998) found that the nonthermal width first increases with temperature, reaching a peak value of 30 km s−1 around 0.3 MK, and then decreases with temperature to values of about 20 km s−1 at coronal temperatures. Hara & Ichimoto (1999) estimated the nonthermal width range in ARs to be 14−26 km s−1 at the temperature range of 1−5 MK. Moreover, the average nonthermal width found by Testa et al. (2016) is 24 km s−1 at the temperature of 1.6 MK in ARs. Brooks & Warren (2016) studied spectral lines in high-temperature loops (1−4 MK) and found the mean nonthermal width to be 17.6 km s−1. The coronal holes have mostly magnetically open structures, showing slightly higher nonthermal widths (e.g., Hahn & Savin 2013).
Many studies suggest that a variety of phenomena could be responsible for the nonthermal broadening in the spectral lines, such as flows (Tian et al. 2012), nanoflares (Patsourakos & Klimchuk 2006), waves (Boland et al. 1975; Cheng et al. 1979; McClements et al. 1991; Tian et al. 2012), shocks (De Pontieu et al. 2015), turbulence (Doschek & Feldman 1977; Pontin et al. 2020), spicules (Doyle et al. 2005). Pontin et al. (2020) explained the nonthermal broadening in coronal loops as being due to turbulent motions in response to the relaxation of braided magnetic fields, finding significant anisotropies of the nonthermal motions favoring motions perpendicular to the (guide) field. Although there is much speculation regarding the physical nature of the nonthermal motions, no firm conclusion has been reached so far.
The characteristics of nonthermal motions were also explored by applying center-to-limb measurements to lines from the chromosphere, transition region, and corona (e.g., Mariska et al. 1978). Roussel-Dupre et al. (1979) studied the Si IV 1393 Å line in the transition region of the QS. These authors found a remarkable increase in the line width from center to limb, which could be mostly attributed to the increase in the optical depth of emitting regions toward the limb. Their results indicated that the nonthermal motions within the quiet transition region are approximately isotropic. Erdelyi et al. (1998) found a clear center-to-limb increase in excess broadening in the upper chromospheric and transition region lines, but only a slight difference in the coronal lines. Their numerical estimation based on linear magnetohydrodynamics (MHD) favored the existence of Alfvén wave heating over magneto-acoustic heating. The results of Chae et al. (1998) showed that the measured nonthermal motions from the transition region and corona of the QS show no significant center-to-limb variation, meaning that the nonthermal motions are isotropic. A study by Peter (1999) presented different results, namely that both the nonthermal widths of the C IV line from the middle transition region and Ne VIII line from the upper transition region decrease towards the limb. The nonthermal width of C IV shows a decrease of about 20% compared with its center value 15 km s−1. Peter (1999) suggested that the nonthermal motions are anisotropic and dominated by the vertical component. Another analysis of C IV, Ne VIII, and He I made by Doyle et al. (2000) found that both C IV and He I line widths show a center-to-limb increase while the Ne VIII line width remains invariant. These latter authors concluded that the lines are broadened by opacity effects, implying nonthermal motions are isotropic in the chromosphere, transition region, and corona.
Previous studies of nonthermal broadening by applying the center-to-limb measurement mainly focused on QS, or did not distinguish between ARs and QS. In addition, the properties of the unresolved motions in ARs and QS could be different. To the best of our knowledge, the characteristics of nonthermal motions in terms of center-to-limb variation in the transition region of ARs have not been systemically investigated. In the present study, we analyze the Si IV doublet lines 1394 Å and 1403 Å from the transition region from AR observations, and perform a statistical analysis of the nonthermal width using the center-to-limb measurement. The main purpose of the present study is to investigate whether there exists a center-to-limb variation of the nonthermal width in ARs. The article is organized as follows: In Sect. 2, we describe the observations and data analysis. Our results and a discussion of QS and ARs are presented in Sect. 3. Finally, we summarize our findings in Sect. 4.
2. Observations and analysis
We used Level-2 IRIS raster data in the present study. In total, we found 424 observations, of which 382 belong to ARs and 42 belong to QS regions. Details of these observations (date and time, location, field of view (FOV), number of raster, step increment, and exposure time) can be found in the attachment file. Figure 1 shows the distribution of all the selected ARs and QS regions on the solar disk. We note that the full disk image of the Sun in Fig. 1 taken in 171 Å channel of the atmospheric imaging assembly (AIA; Lemen et al. 2012) on board solar dynamics observatory (SDO; Pesnell et al. 2012) is used as a schematic diagram only, and does not show our selected ARs and QS regions. The 382 observations of ARs belong to 31 tracking observations. The tracking observations refer to the monitoring of the same AR following solar rotation from the east limb to the west limb. Unlike the ARs, the QS region is rarely tracked by IRIS. Therefore, we simply looked for the observations of QS in different regions of the solar disk to best satisfy the center-to-limb measurement.
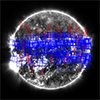 |
Fig. 1. Distribution of all the selected ARs and QS regions on the solar disk. The blue and red rectangles denote the IRIS raster FOVs of selected ARs and QS regions respectively. |
The Si IV doublet lines 1393.78 Å and 1402.77 Å (logT [K] = 4.9) from the transition region were used to study the nonthermal motions in ARs. In data processing, we tried both methods of spatial binning and spectral binning, and got very close results. We eventually adopted the spatial binning because it introduces smaller errors and requires less computation time. Considering that the ARs are represented by the hot, dense loops in the transition region, we applied thresholds on the constructed raster images to extract the pixels with strong emission, and excluded the backgrounds indicated by the pixels with weak emission. We manually selected the thresholds that differ for different AR observations. Figure 2 shows an example of the above processing. Only the positions indicated by the selected pixels in AR spectral data are processed in the following steps. For the QS regions, we kept all the pixels in the constructed raster images. Further, the routine mpfitfun provided in Solarsoft (Freeland & Handy 1998) was used to perform the single Gaussian fitting on the average spectral line profiles of ARs and QS. We determined the peak intensity Ip and 1/e line width σ from the fits. The latter is used to calculate the nonthermal width σnth with  , where σth is calculated assuming the plasma is at log T[K] = 4.9, i.e. at the transition temperature of Si IV, and σinst = 0.0318 Å (De Pontieu et al. 2014).
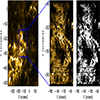 |
Fig. 2. Process of extracting the pixels with strong emission in ARs. The left image taken from AIA 171 Å shows the location of a selected AR. The middle image is the constructed raster image of the same AR from Si IV 1394 Å. The blue box in the left image shows the FOV of the raster image. The right image is the mask, presenting the pixels to extract after the threshold has been applied. |
3. Results and discussion
3.1. Quiet Sun properties
Roussel-Dupre et al. (1979) calculated the optical depth of Si IV 1394 at the center of the line at disk center using the ratios of the integrated intensities from center to limb to the integrated intensities at disk center. In this study, we applied a more precise method, using the doublet lines Si IV 1394 Å and 1403 Å to calculate the optical depth. Part of the work of Roussel-Dupre et al. (1979) is verified with the higher resolution data from IRIS. Figure 3 shows the statistical results of QS as a function of μ in three aspects: the peak intensity ratio (or line ratio), the peak intensity, and the nonthermal width. The μ-value is defined as the cosine of the angle between the surface normal and the LOS to the observer of the center of the FOV (Thompson 2006).
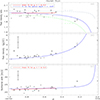 |
Fig. 3. Variations in peak intensity ratio, peak intensity, and nonthermal width of QS from the disk center to limb. Panel a: scatter plot of peak intensity ratios of Si IV 1394 Å to Si IV 1403 Å and the nonlinear fitting (blue curve) performed using Eq. (A.5). The upper and lower dashed curves are calculated according to Eq. (A.5) with τ0 ± 3σ (σ is the standard deviation of τ0) respectively. The red line is a linear fitting of peak intensity ratios in the range of μ = 1.0−0.4. Panel b: scatter plot of normalized peak intensities of Si IV 1394 Å and the theoretical normalized peak intensities (blue curve) calculated using τ0 and Eq. (B.2). Panel c: scatter plot of nonthermal widths of Si IV 1394 Å and the theoretical nonthermal widths (blue curve) obtained using τ0 and Eq. (C.1). The red line is a linear fitting of nonthermal widths in the range of μ = 1.0−0.4. The vertical dashed lines in the three images mark the location of μ = 0.4. We note that μ = 1.0 corresponds to closer to the disk center, whereas μ = 0.0 corresponds to closer to the limb. |
3.1.1. Peak intensity ratio and optical depth
The panel a of Fig. 3 shows the variation of peak intensity ratios of Si IV 1394 Å to Si IV 1403 Å of QS from the disk center to limb. The 3σ average error of peak intensity ratios is 1.39. The intensity ratio of two lines in a doublet can be used to test whether a line is optically thin or not (e.g., Zirin 1988). The details of this method are given in Appendix A. We performed a nonlinear fitting of the peak intensity ratios of the doublet lines Si IV 1394 Å to Si IV 1403 Å, and derived the optical depth of Si IV at line center at disk center as τ0 = 0.07 ± 0.02. This value is smaller that given by Roussel-Dupre et al. (1979), of namely τ0 = 0.22. Though the peak intensity ratios of QS are scattered, most peak intensity ratios are within the 3σ boundaries (indicated by the two dashed curves). From the fit for optical depth τ0 = 0.07, we calculated a peak intensity ratio of r = 1.97 at disk center. The intensity of Si IV 1394 Å is a factor of about two stronger than the intensity of Si IV 1403 Å under the conditions of optically thin plasma, which can be derived using CHIANTI (Dere et al. 1996; Landi et al. 2013). Therefore, we conclude that the line Si IV is optically thin in QS at disk center. The linear fitting of the peak intensity ratios in the range of μ = 1.0−0.4 gives the slope of −0.01 ± 0.06. The value of the slope indicates that the peak intensity ratios do not deviate significantly from 1.97, which suggests that Si IV lines are optically thin in this range as well. However, the peak intensity ratios drop drastically in the range of μ = 0.4−0. The enhancement of the opacity effects close to the solar limb are responsible for the significant decrease.
3.1.2. Peak intensity
The center-to-limb variation in the normalized peak intensities of Si IV 1394 Å of QS is shown in panel b of Fig. 3. The peak intensities are normalized with the peak intensities closest to the center of the Sun (μ = 1.0). The 3σ average error of normalized peak intensities indicated by the error bar is 1.29. We also calculated the normalized theoretical peak intensities of line Si IV 1394 Å using τ0 obtained from the fit to the line ratios in the previous Sect. 3.1.1 and Eq. (B.2) (see details in Appendix B). The peak intensities of Si IV 1394 Å in the QS are consistent with the calculated theoretical peak intensities, both of which increase from the disk center to limb. We note that the theoretical normalized peak intensity was calculated under the assumption that the source function is constant (see Appendix A). The increase in optical depth is considered to be responsible for the increase in peak intensities towards the limb. Wilhelm et al. (1998) found that most of the UV and EUV lines from the QS increase in peak intensities from the disk center to limb. Our result is consistent with the results of Wilhelm et al. (1998) and Roussel-Dupre et al. (1979).
3.1.3. Nonthermal width
Panel c of Fig. 3 presents the center-to-limb variation of nonthermal widths of Si IV 1394 Å for the QS. The theoretical nonthermal widths are calculated under the assumption that the nonthermal motions are isotropic (see details in Appendix C). The nonthermal widths for the QS are mostly distributed in the range of 20−24 km s−1 on the solar disk where μ = 1.0−0.4. The 3σ average error of nonthermal widths indicated by the error bar is 2.98 km s−1. There is a slight increase in both the observed and theoretical nonthermal widths in the range of μ = 1.0−0.4, which is also confirmed by the slope of −1.94 ± 0.15 given by the linear fitting. Although there are few observations of QS near the solar limb (μ = 0.4−0), the increase in nonthermal widths can still be observed. The increase in nonthermal widths for the QS was also found by Rao et al. (2022). The observed nonthermal widths for the QS are consistent with predictions by the theory based on the assumption of isotropic nonthermal motions and the value of τ0 as derived in Sect. 3.1.1. Furthermore, as we discuss in Sect. 3.1.1, Si IV 1394 Å is optically thin in the range of μ = 1.0−0.4, implying that the nonthermal width is not significantly influenced by the opacity. When the position reaches the limb on the solar disk (μ = 0.4−0), the opacity effects begin to play a more important role and the nonthermal widths increase significantly. This is underlined by the theoretical variation shown by the blue curve in panel c of Fig. 3. Therefore, we conclude that the increase in nonthermal widths with distance from the disk center is mainly due to the increase in the optical depth of the emitting regions in the QS towards the limb, and the nonthermal motions in the QS are isotropic.
3.2. Properties of active regions
The statistical results for ARs are presented as a function of μ for the same three aspects: the peak intensity ratio, the peak intensity, and the nonthermal width. The theoretical peak intensity and nonthermal width are also calculated using the same assumptions and methods as we discuss in Sect. 3.1. The present study mainly focuses on the nonthermal motions in ARs, and the results for the QS are used as benchmark.
3.2.1. Peak intensity ratio and optical depth
The panel a of Fig. 4 shows the variation of peak intensity ratios of Si IV 1394 Å to Si IV 1403 Å of ARs from the disk center to limb. The same nonlinear fitting as used above was performed on the peak intensity ratios of the doublet lines Si IV 1394 Å to Si IV 1403 Å, now for ARs. The optical depth of Si IV at line center at disk center is τ0 = 0.08 ± 0.01 from the fitting, and the 3σ average error of peak intensity ratios is 0.64. We can see that the optical depths of Si IV lines obtained from ARs and QS are almost the same, and consistent within the uncertainties. The peak intensity ratio at the center of the solar disk is 1.96, meaning that the line Si IV is also optically thin in ARs at disk center. We also performed a linear fitting on the peak intensity ratios in the range of μ = 1.0−0.4. The slope of 0.05 ± 0.01 shows a slight decrease in the peak intensity ratios in this range. Similar to the results for the QS, the intensity ratios remain at a value of 1.96 on the solar disk where μ = 1.0−0.4, indicating that Si IV doublet lines are also optically thin in this range. The peak intensity ratios decrease significantly for observations of ARs close to the solar limb (μ = 0.4−0). We think that the increase in the optical depth is still the main reason for this phenomenon.
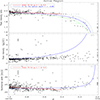 |
Fig. 4. Variations in peak intensity ratio, peak intensity, and nonthermal width of ARs from the disk center to limb. Please refer to Fig. 3 for the full description. |
3.2.2. Peak intensity
The center-to-limb variation in the normalized peak intensities of Si IV 1394 Å of ARs is shown in panel b of Fig. 4. For each tracking observation, the peak intensities are normalized with the average of the peak intensities in the range of μ = 1.0−0.8. The 3σ average error of normalized peak intensities indicated by the error bar is 0.18. The normalized theoretical peak intensities of the Si IV 1394 Å line of ARs are also calculated using the same method as for the QS. We can see that the observed peak intensities increase slightly from center to limb in the Sun. However, the increase is far less significant than theory predicts. In general, the observed peak intensities are lower than the theoretical peak intensities. We think there could be two reasons for this inconsistency. First, the emission of an AR varies as the AR evolves, implying that the AR is in violation of the assumption of the source function being constant. In the tracking observations of ARs, the AR will be picked because of its excess emission when rotating onto the disk near the east limb. This AR will evolve while it rotates across the disk over the course of about 14 days. Because 14 days is a considerable fraction of the lifetime for many ARs, many of the ARs caught near the east limb will be in the rising phase, and many of the ARs on their way to the west limb will be in the declining phase. The evolution of the ARs could therefore reduce the expected increase in peak intensity towards the limb. Second, the AR is represented by the dense transition region loops connecting the opposite magnetic polarities (van Driel-Gesztelyi & Green 2015; Huang et al. 2015). The emission of these loops received by the observer depends on the loop orientation with respect to the line of sight. At the center of the Sun, most of the emission in ARs comes from the loops. However, the emission of the background plays an increasingly important role in ARs because of the projection effect toward the solar limb. On account of the fact that the emission of the loops is much stronger than the emission of the background, the peak intensities of ARs tend to decrease from the center to limb. Nevertheless, the opacity effects are still involved, finally causing the slight increase in the observed peak intensities from the disk center to limb. It is the constant source function in Eq. (B.2) that gives the upper limit on the observed peak intensities in ARs.
3.2.3. Nonthermal width
The panel c of Fig. 4 presents the center-to-limb variation of nonthermal widths of Si IV 1394 Å in ARs. As for the QS in Sect. 3.1.3, we calculated the theoretical nonthermal widths. On the solar disk (μ = 1.0−0.4), the nonthermal widths of ARs are distributed over a wide range of 21−27 km s−1. The 3σ average error of nonthermal widths indicated by the error bar is 1.19 km s−1. As opposed to the results for the QS, there is an obvious decrease in the observed nonthermal widths in the range of μ = 1.0−0.4, while the theoretical nonthermal widths would slightly increase. Within the same range, the linear fitting slope of the observed nonthermal widths is 3.04 ± 0.06, which also demonstrates a decrease in the observed nonthermal widths. According to the linear fit, the nonthermal broadening would drop from more than 23 km s−1 at disk center by more than 2 km s−1 to μ = 0.4. As we mention above, the calculation of the theoretical nonthermal widths assumes that nonthermal motions are isotropic. The clear decrease in the observed nonthermal widths in the range of μ = 1.0−0.4 leads to the result that the nonthermal motions in ARs have to be anisotropic, with the vertical component being greater than the horizontal one. In previous studies, Peter (1999) also found a decrease in nonthermal widths with C IV and Ne VIII lines from the center-to-limb observations. In the range of μ = 0.4−0, both the observed and theoretical nonthermal widths increase significantly toward the limb. We think that this is still due to the increase in the optical depth of ARs in this range (Roussel-Dupre et al. 1979; Mariska 1992). Furthermore, the observed nonthermal widths at disk center (μ closes to 1.0) and at solar limb (μ closes to 0) have roughly equal values, which was also found in previous studies (e.g., Akiyama et al. 2005; Hara et al. 2008). However, these studies overlooked the fact that the nonthermal broadening first drops on the disk when moving away from disk center before rising again to the same value near the limb. We interpret this as the combination of nonisotropies (predominantly vertical) on the disk and opacity effects closer to the limb.
4. Summary
In the present study, we aim to study the characteristics of nonthermal motions in the transition region of ARs using the center-to-limb measurement. We analyzed the Si IV doublet lines 1394 Å and 1403 Å from 382 observations of ARs and 42 observations of QS regions. The results for ARs and QS cover three aspects: the peak intensity ratio, the peak intensity, and the nonthermal width.
Through the nonlinear fitting of the peak intensity ratios, we find that the optical depths of Si IV lines at line center and disk center in ARs and the QS are 0.08 ± 0.01 and 0.07 ± 0.02, respectively. The optical depths of Si IV at line center and disk center are extremely close in ARs and the QS. Furthermore, the Si IV doublet lines are found to be optically thin in both ARs and the QS. Both the observed peak intensities in ARs and the QS show an increase from the disk center to limb.
The central result of our study is that the nonthermal motions are clearly decreasing over the disk with increasing distance from disk center. Only close to the limb, clearly beyond μ = 0.4, does the nonthermal broadening increase again towards the limb because of opacity effects. The decrease in the nonthermal broadening in ARs away from disk center is markedly different from the QS. While the almost constant nonthermal widths indicate isotropic motions, the drop in ARs would be consistent with the vertical motions being (slightly) larger than the horizontal motions on average. With the assumption that in the transition region the magnetic field is still mostly vertical, this would imply an isotropy of the motions with respect to the magnetic field, with higher speeds along the guide field than across it.
Acknowledgments
We would like to thank the referee for the comments and suggestions. This research is supported by the National Natural Science Foundation of China (41974201, U1831112) and the Young Scholar Program of Shandong University, Weihai (2017WHWLJH07). IRIS is a NASA small explorer mission developed and operated by LMSAL with mission operations executed at NASA Ames Research center and major contributions to downlink communications funded by the Norwegian Space Center through an ESA PRODEX contract. The AIA data are provided courtesy of NASA/SDO and corresponding science teams. The AIA data have been retrieved using the Stanford University’s Joint Science Operations Centre/Science Data Processing Facility.
References
- Akiyama, S., Doschek, G. A., & Mariska, J. T. 2005, ApJ, 623, 540 [NASA ADS] [CrossRef] [Google Scholar]
- Benz, A. O. 2017, Liv. Rev. Sol. Phys., 14, 2 [Google Scholar]
- Boland, B. C., Engstrom, S. F. T., Jones, B. B., & Wilson, R. 1973, A&A, 22, 161 [NASA ADS] [Google Scholar]
- Boland, B. C., Dyer, E. P., Firth, J. G., et al. 1975, MNRAS, 171, 697 [NASA ADS] [CrossRef] [Google Scholar]
- Brooks, D. H., & Warren, H. P. 2016, ApJ, 820, 63 [Google Scholar]
- Chae, J., Schühle, U., & Lemaire, P. 1998, ApJ, 505, 957 [NASA ADS] [CrossRef] [Google Scholar]
- Cheng, C. C., Doschek, G. A., & Feldman, U. 1979, ApJ, 227, 1037 [NASA ADS] [CrossRef] [Google Scholar]
- De Pontieu, B., Title, A. M., Lemen, J. R., et al. 2014, Sol. Phys., 289, 2733 [Google Scholar]
- De Pontieu, B., McIntosh, S., Martinez-Sykora, J., Peter, H., & Pereira, T. M. D. 2015, ApJ, 799, L12 [Google Scholar]
- Dere, K. P., & Mason, H. E. 1993, Sol. Phys., 144, 217 [NASA ADS] [CrossRef] [Google Scholar]
- Dere, K. P., Monsignori-Fossi, B. C., Landi, E., Mason, H. E., & Young, P. R. 1996, Am. Astron. Soc. Meet. Abstr., 188, 85.01 [NASA ADS] [Google Scholar]
- Doschek, G. A., & Feldman, U. 1977, ApJ, 212, L143 [CrossRef] [Google Scholar]
- Doschek, G. A., Feldman, U., & Tousey, R. 1975, ApJ, 202, L151 [NASA ADS] [CrossRef] [Google Scholar]
- Doyle, J. G., Teriaca, L., & Banerjee, D. 2000, A&A, 356, 335 [NASA ADS] [Google Scholar]
- Doyle, J. G., Giannikakis, J., Xia, L. D., & Madjarska, M. S. 2005, A&A, 431, L17 [NASA ADS] [CrossRef] [EDP Sciences] [Google Scholar]
- Erdelyi, R., Doyle, J. G., Perez, M. E., & Wilhelm, K. 1998, A&A, 337, 287 [NASA ADS] [Google Scholar]
- Feldman, U., & Behring, W. E. 1974, ApJ, 189, L45 [NASA ADS] [CrossRef] [Google Scholar]
- Feldman, U., Doschek, G. A., & Patterson, N. P. 1976, ApJ, 209, 270 [NASA ADS] [CrossRef] [Google Scholar]
- Freeland, S. L., & Handy, B. N. 1998, Sol. Phys., 182, 497 [Google Scholar]
- Hahn, M., & Savin, D. W. 2013, ApJ, 763, 106 [NASA ADS] [CrossRef] [Google Scholar]
- Hara, H., & Ichimoto, K. 1999, ApJ, 513, 969 [NASA ADS] [CrossRef] [Google Scholar]
- Hara, H., Watanabe, T., Harra, L. K., et al. 2008, ApJ, 678, L67 [NASA ADS] [CrossRef] [Google Scholar]
- Hou, Z., Huang, Z., Xia, L., et al. 2016, ApJ, 829, L30 [NASA ADS] [CrossRef] [Google Scholar]
- Huang, Z., Xia, L., Li, B., & Madjarska, M. S. 2015, ApJ, 810, 46 [NASA ADS] [CrossRef] [Google Scholar]
- Landi, E., Young, P. R., Dere, K. P., Del Zanna, G., & Mason, H. E. 2013, ApJ, 763, 86 [CrossRef] [Google Scholar]
- Lemen, J. R., Title, A. M., Akin, D. J., et al. 2012, Sol. Phys., 275, 17 [Google Scholar]
- Mariska, J. T. 1992, The Solar Transition Region (Cambridge: Cambridge University Press), 290 [Google Scholar]
- Mariska, J. T., Feldman, U., & Doschek, G. A. 1978, ApJ, 226, 698 [NASA ADS] [CrossRef] [Google Scholar]
- McClements, K. G., Harrison, R. A., & Alexander, D. 1991, Sol. Phys., 131, 41 [NASA ADS] [CrossRef] [Google Scholar]
- Patsourakos, S., & Klimchuk, J. A. 2006, ApJ, 647, 1452 [NASA ADS] [CrossRef] [Google Scholar]
- Pesnell, W. D., Thompson, B. J., & Chamberlin, P. C. 2012, Sol. Phys., 275, 3 [Google Scholar]
- Peter, H. 1999, ApJ, 516, 490 [NASA ADS] [CrossRef] [Google Scholar]
- Pontin, D. I., Peter, H., & Chitta, L. P. 2020, A&A, 639, A21 [NASA ADS] [CrossRef] [EDP Sciences] [Google Scholar]
- Rao, Y. K., Del Zanna, G., & Mason, H. E. 2022, MNRAS, 511, 1383 [NASA ADS] [Google Scholar]
- Roussel-Dupre, R., Francis, M. H., & Billings, D. E. 1979, MNRAS, 187, 9 [NASA ADS] [CrossRef] [Google Scholar]
- Testa, P., De Pontieu, B., & Hansteen, V. 2016, ApJ, 827, 99 [NASA ADS] [CrossRef] [Google Scholar]
- Thompson, W. T. 2006, A&A, 449, 791 [NASA ADS] [CrossRef] [EDP Sciences] [Google Scholar]
- Tian, H., McIntosh, S. W., Wang, T., et al. 2012, ApJ, 759, 144 [Google Scholar]
- van Driel-Gesztelyi, L., & Green, L. M. 2015, Liv. Rev. Sol. Phys., 12, 1 [Google Scholar]
- Webb, D. F., & Howard, T. A. 2012, Liv. Rev. Sol. Phys., 9, 3 [Google Scholar]
- Wilhelm, K., Lemaire, P., Dammasch, I. E., et al. 1998, A&A, 334, 685 [NASA ADS] [Google Scholar]
- Zirin, H. 1988, Astrophysics of the Sun (Cambridge: Cambridge University Press), 440 [Google Scholar]
Appendix A: Peak intensity ratio and optical depth
The optical depth of a spectral line at line center and disk center can be calculated using the intensity ratio of two lines in a doublet (e.g., Zirin 1988). The method has been widely used in many studies to test whether a line is optically thin or not (e.g., Dere & Mason 1993; Chae et al. 1998; Hou et al. 2016). Next, we provide a detailed deduction of the theoretical method that is applied to calculate the optical depth, the theoretical normalized peak intensity, and the theoretical nonthermal width in the previous sections. According to the radiative transfer equation in Zirin (1988), assuming that the source function Sλ is constant, the emission intensity of a spectral line at disk center is
![Mathematical equation: $$ \begin{aligned} I_{\nu }(\tau _{\lambda }) = S_{\lambda }\,\left[1 - exp\left(-\tau _{\lambda }\right)\right], \end{aligned} $$](/articles/aa/full_html/2022/04/aa42285-21/aa42285-21-eq2.gif) (A.1)
(A.1)
where λ is the wavelength and τλ is the optical depth at disk center. If the variation of the optical depth across the solar disk is considered, the Eq. A.1 will become
![Mathematical equation: $$ \begin{aligned} I(\tau ,\,\mu ) = S\,\left[1 - exp\left(-\frac{\tau }{\mu }\right)\right], \end{aligned} $$](/articles/aa/full_html/2022/04/aa42285-21/aa42285-21-eq3.gif) (A.2)
(A.2)
where μ is defined as the cosine of the angle between the surface normal and the LOS to the observer. Here we leave out the subscript λ for simplification. Furthermore, the optical depth τ can also be described in a Gaussian profile as a good approximation (see, e.g., Roussel-Dupre et al. 1979; Dere & Mason 1993; Chae et al. 1998). By introducing τ0 as the optical depth at line center and disk center, the optical depth τ will become
![Mathematical equation: $$ \begin{aligned} \tau (\lambda ) = \tau _0\,exp\left[-\frac{(\lambda - \lambda _0)^2}{2\sigma ^2}\right], \end{aligned} $$](/articles/aa/full_html/2022/04/aa42285-21/aa42285-21-eq4.gif) (A.3)
(A.3)
where λ is the wavelength, λ − λ0 is the Doppler shift and σ is the Gaussian width. Substitute τ in Eq. A.2 with Eq. A.3, we eventually have the expression of the spectral line profile with the influence of the optical depth:
![Mathematical equation: $$ \begin{aligned} I(\lambda ,\,\mu ) = S\left\{ 1 - exp\left[-\frac{\tau _0 exp\left[-\frac{(\lambda - \lambda _0)^2}{2\sigma ^2}\right]}{\mu }\right]\right\} \cdot \end{aligned} $$](/articles/aa/full_html/2022/04/aa42285-21/aa42285-21-eq5.gif) (A.4)
(A.4)
As the transition probabilities are proportional to the statistical weights of the final states (Zirin 1988), the relationship between optical depths of Si IV 1394 Å and 1403 Å is τ1394 = 2 τ1403. If assuming that ![Mathematical equation: $ \tau_{1394} = \tau_0\, exp\left[-\frac{(\lambda-\lambda_0)^2}{2\sigma^2}\right] $](/articles/aa/full_html/2022/04/aa42285-21/aa42285-21-eq6.gif) , and based on Eq. A.3, we obtain the peak intensity ratio at line center (λ = λ0):
, and based on Eq. A.3, we obtain the peak intensity ratio at line center (λ = λ0):
 (A.5)
(A.5)
where Ip 1394 and Ip 1403 are the peak intensities of Si IV 1394 Å and 1403 Å respectively. We can use Eq. A.5 to fit the observed peak intensity ratios r and get τ0, the optical depth at line center and disk center (see Section 3.1.1 and Section 3.2.1).
Appendix B: Peak intensity
At line center where λ = λ0, Eq. A.4 results in the theoretical expression of the peak intensity:
![Mathematical equation: $$ \begin{aligned} I_p(\mu ) = S\left[1 - exp\left(-\frac{\tau _0}{\mu }\right)\right]\cdot \end{aligned} $$](/articles/aa/full_html/2022/04/aa42285-21/aa42285-21-eq8.gif) (B.1)
(B.1)
From Eq. B.1, the normalized peak intensity Inp is expressed by dividing the peak intensity at disk center (μ = 1):
 (B.2)
(B.2)
We can now use τ0 obtained from the fitting of the observed peak intensity ratios based on Eq. A.5 to calculate the theoretical normalized peak intensities based on Eq. B.2. This is shown by the blue curve in the middle panels of Fig. 3 and Fig. 4.
We note that Roussel-Dupre et al. (1979) used the same equation Eq. B.1 to express the integrated intensity instead of the peak intensity in their study, which, strictly speaking, is not correct. We guess that they may have confused the integrated intensity with the peak intensity. As a validation, we find that if τ0 ≪ 1 and the location is at the center of the Sun (μ = 1.0), the values of peak intensity ratio and integrated intensity ratio are very close. However, the difference becomes larger when τ0 gets larger or μ gets smaller.
Appendix C: Nonthermal width
We assume that the nonthermal motions are isotropic, namely the Gaussian width σ is constant. Here we set σ to 22.0 km s−1, corresponding to the observed nonthermal widths at disk center. The source function S is assumed to be constant and set to 1, and the λ0 is set to 0. Therefore, Eq. A.4 simplifies to
![Mathematical equation: $$ \begin{aligned} I(\lambda ,\,\mu ) = 1 - exp \left[-\frac{\tau _0 exp\left(-\frac{\lambda ^2}{968}\right)}{\mu }\right]. \end{aligned} $$](/articles/aa/full_html/2022/04/aa42285-21/aa42285-21-eq10.gif) (C.1)
(C.1)
We note that Eq. C.1 is the expression of the spectral line profile influenced by the effects of opacity. We performed a standard Gaussian fitting on Eq. C.1. For the fitting we use the value for τ0 as derived from the fit to the line ratio as a function of μ based on Eq. A.5. From this fit, we find the theoretical nonthermal widths, which are indicated by the blue curve in the bottom images in Fig. 3 and Fig. 4. Dere & Mason (1993) also used this method to calculate the “measured” nonthermal velocities as a function of the optical depth at line center in the C IV 1548 line.
All Figures
|
Fig. 1. Distribution of all the selected ARs and QS regions on the solar disk. The blue and red rectangles denote the IRIS raster FOVs of selected ARs and QS regions respectively. |
| In the text | |
|
Fig. 2. Process of extracting the pixels with strong emission in ARs. The left image taken from AIA 171 Å shows the location of a selected AR. The middle image is the constructed raster image of the same AR from Si IV 1394 Å. The blue box in the left image shows the FOV of the raster image. The right image is the mask, presenting the pixels to extract after the threshold has been applied. |
| In the text | |
|
Fig. 3. Variations in peak intensity ratio, peak intensity, and nonthermal width of QS from the disk center to limb. Panel a: scatter plot of peak intensity ratios of Si IV 1394 Å to Si IV 1403 Å and the nonlinear fitting (blue curve) performed using Eq. (A.5). The upper and lower dashed curves are calculated according to Eq. (A.5) with τ0 ± 3σ (σ is the standard deviation of τ0) respectively. The red line is a linear fitting of peak intensity ratios in the range of μ = 1.0−0.4. Panel b: scatter plot of normalized peak intensities of Si IV 1394 Å and the theoretical normalized peak intensities (blue curve) calculated using τ0 and Eq. (B.2). Panel c: scatter plot of nonthermal widths of Si IV 1394 Å and the theoretical nonthermal widths (blue curve) obtained using τ0 and Eq. (C.1). The red line is a linear fitting of nonthermal widths in the range of μ = 1.0−0.4. The vertical dashed lines in the three images mark the location of μ = 0.4. We note that μ = 1.0 corresponds to closer to the disk center, whereas μ = 0.0 corresponds to closer to the limb. |
| In the text | |
|
Fig. 4. Variations in peak intensity ratio, peak intensity, and nonthermal width of ARs from the disk center to limb. Please refer to Fig. 3 for the full description. |
| In the text | |
Current usage metrics show cumulative count of Article Views (full-text article views including HTML views, PDF and ePub downloads, according to the available data) and Abstracts Views on Vision4Press platform.
Data correspond to usage on the plateform after 2015. The current usage metrics is available 48-96 hours after online publication and is updated daily on week days.
Initial download of the metrics may take a while.