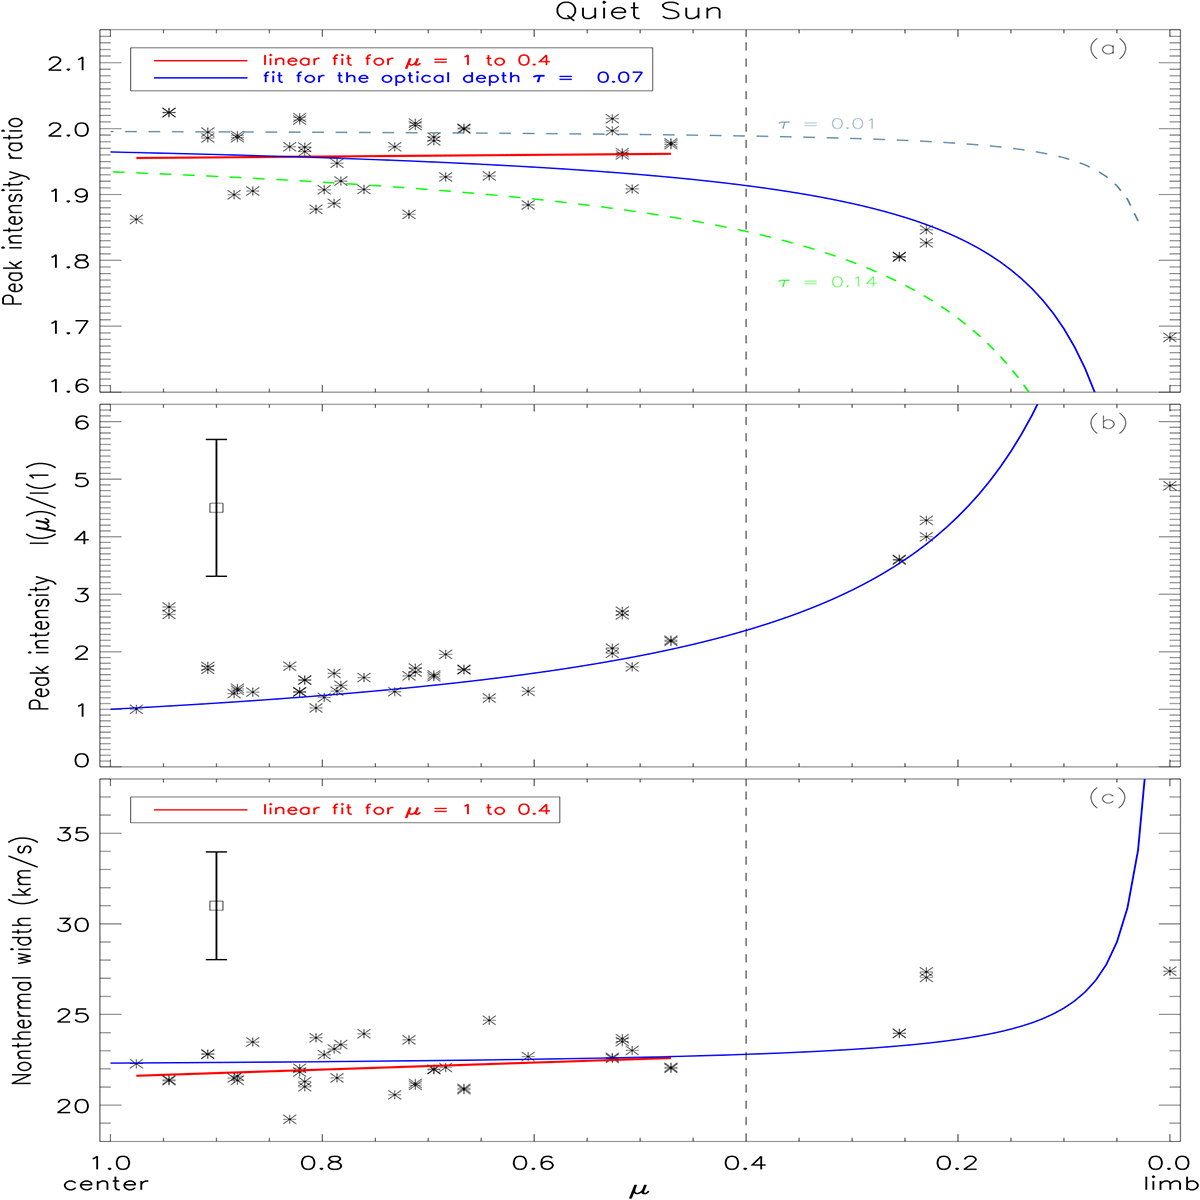
Fig. 3.
Download original image
Variations in peak intensity ratio, peak intensity, and nonthermal width of QS from the disk center to limb. Panel a: scatter plot of peak intensity ratios of Si IV 1394 Å to Si IV 1403 Å and the nonlinear fitting (blue curve) performed using Eq. (A.5). The upper and lower dashed curves are calculated according to Eq. (A.5) with τ0 ± 3σ (σ is the standard deviation of τ0) respectively. The red line is a linear fitting of peak intensity ratios in the range of μ = 1.0−0.4. Panel b: scatter plot of normalized peak intensities of Si IV 1394 Å and the theoretical normalized peak intensities (blue curve) calculated using τ0 and Eq. (B.2). Panel c: scatter plot of nonthermal widths of Si IV 1394 Å and the theoretical nonthermal widths (blue curve) obtained using τ0 and Eq. (C.1). The red line is a linear fitting of nonthermal widths in the range of μ = 1.0−0.4. The vertical dashed lines in the three images mark the location of μ = 0.4. We note that μ = 1.0 corresponds to closer to the disk center, whereas μ = 0.0 corresponds to closer to the limb.
Current usage metrics show cumulative count of Article Views (full-text article views including HTML views, PDF and ePub downloads, according to the available data) and Abstracts Views on Vision4Press platform.
Data correspond to usage on the plateform after 2015. The current usage metrics is available 48-96 hours after online publication and is updated daily on week days.
Initial download of the metrics may take a while.