Free Access
Fig. 1.
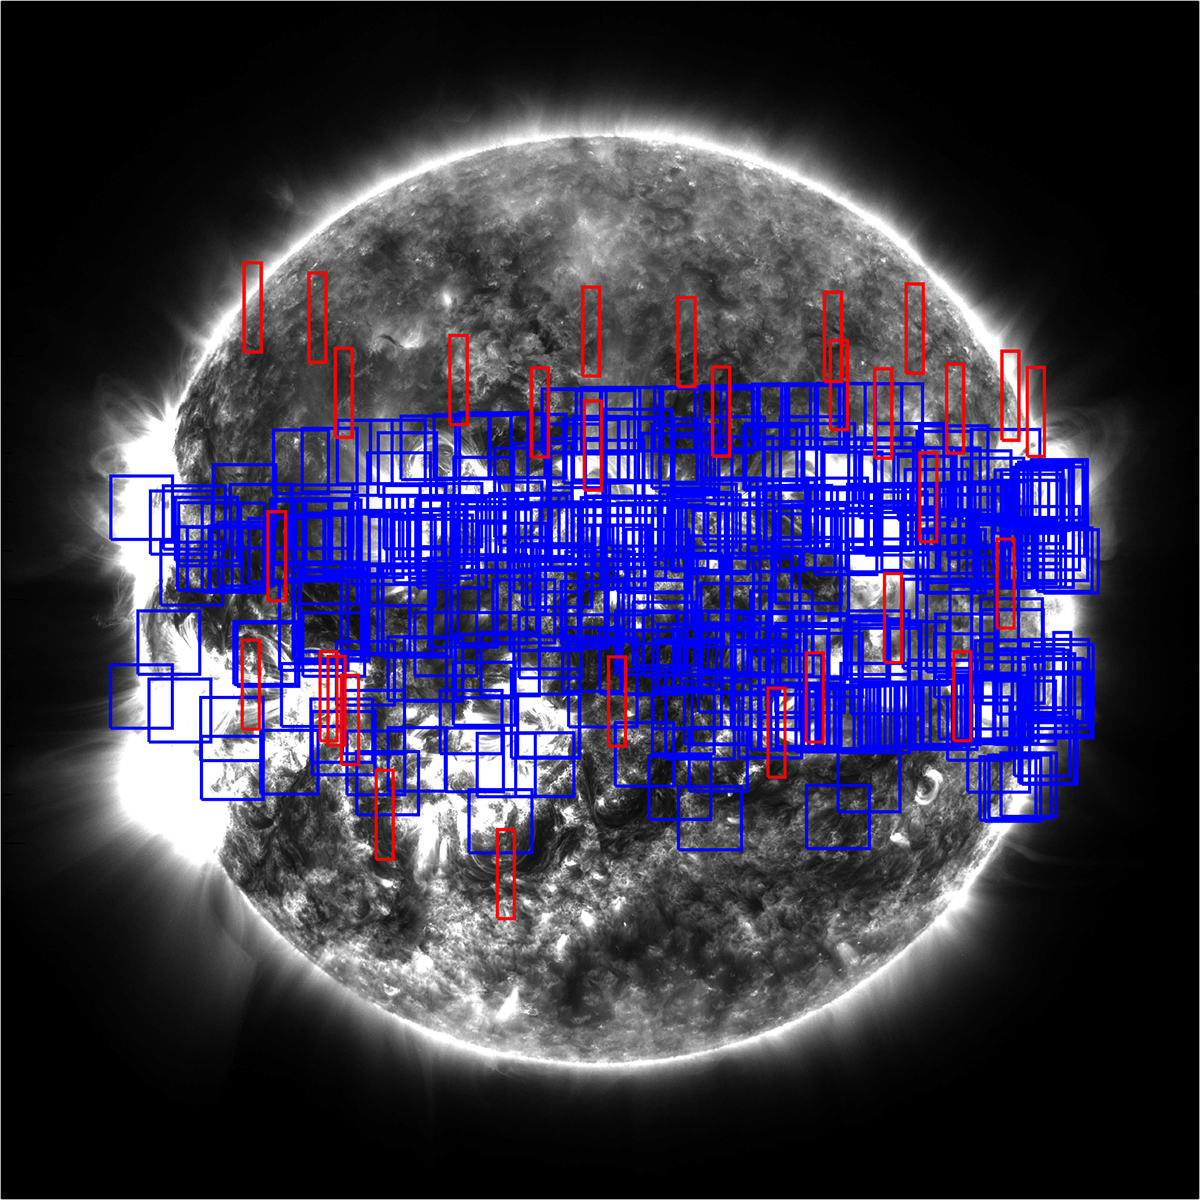
Download original image
Distribution of all the selected ARs and QS regions on the solar disk. The blue and red rectangles denote the IRIS raster FOVs of selected ARs and QS regions respectively.
Current usage metrics show cumulative count of Article Views (full-text article views including HTML views, PDF and ePub downloads, according to the available data) and Abstracts Views on Vision4Press platform.
Data correspond to usage on the plateform after 2015. The current usage metrics is available 48-96 hours after online publication and is updated daily on week days.
Initial download of the metrics may take a while.