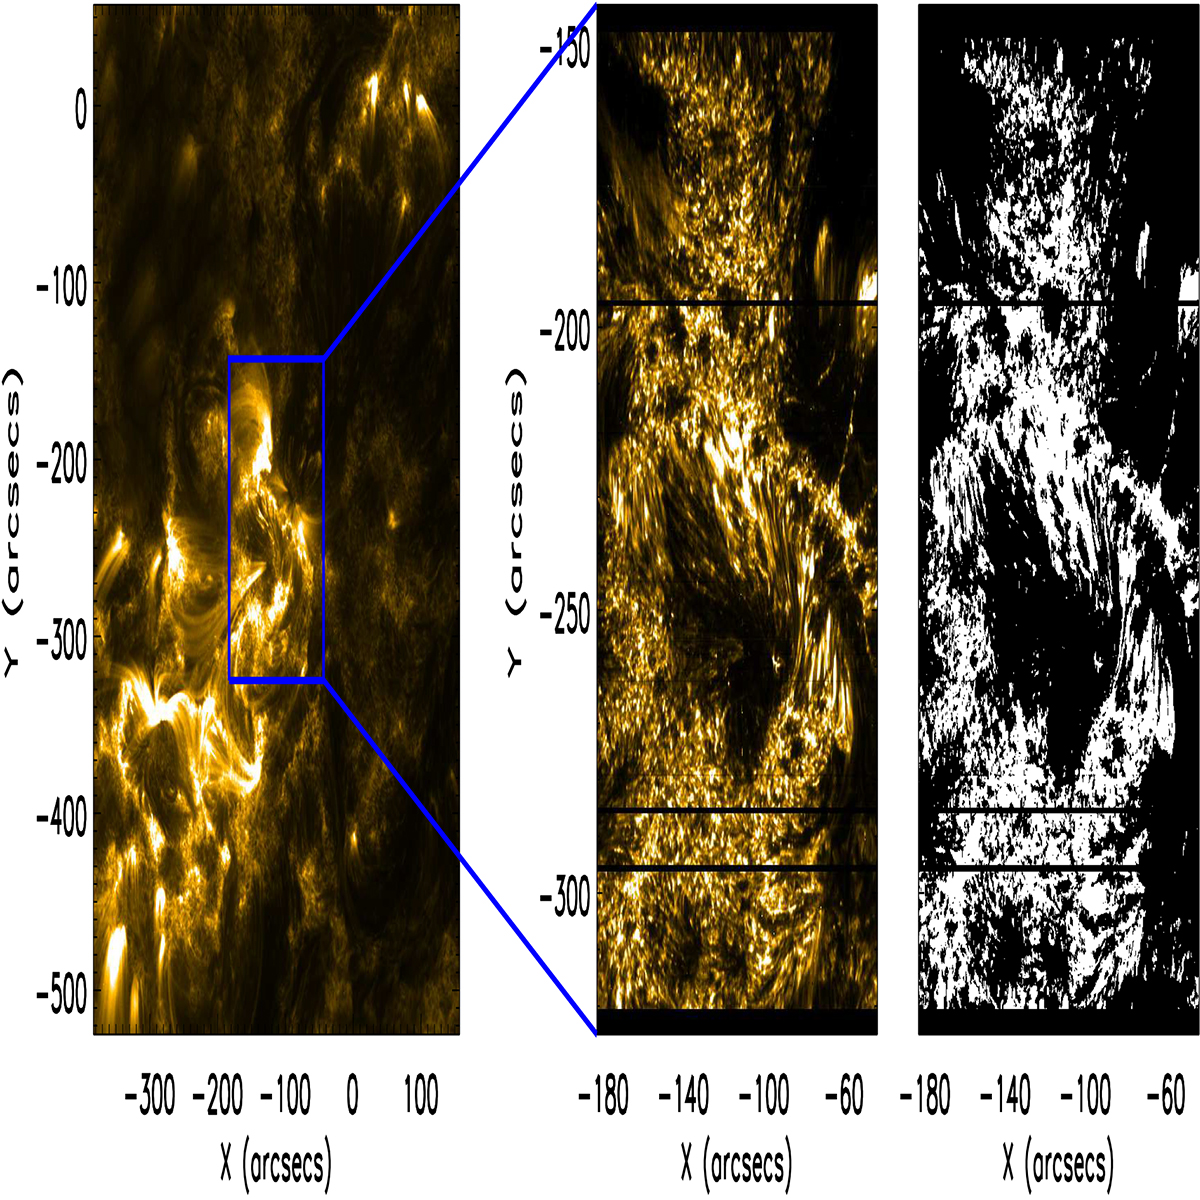
Fig. 2.
Download original image
Process of extracting the pixels with strong emission in ARs. The left image taken from AIA 171 Å shows the location of a selected AR. The middle image is the constructed raster image of the same AR from Si IV 1394 Å. The blue box in the left image shows the FOV of the raster image. The right image is the mask, presenting the pixels to extract after the threshold has been applied.
Current usage metrics show cumulative count of Article Views (full-text article views including HTML views, PDF and ePub downloads, according to the available data) and Abstracts Views on Vision4Press platform.
Data correspond to usage on the plateform after 2015. The current usage metrics is available 48-96 hours after online publication and is updated daily on week days.
Initial download of the metrics may take a while.