| Issue |
A&A
Volume 659, March 2022
|
|
|---|---|---|
| Article Number | A41 | |
| Number of page(s) | 8 | |
| Section | Stellar structure and evolution | |
| DOI | https://doi.org/10.1051/0004-6361/202142598 | |
| Published online | 02 March 2022 | |
VLA proper motion constraints on the origin, age, and potential magnetar future of PSR J1734−3333
1
Departamento de Física, Universidad de Santiago de Chile (USACH), Av. Victor Jara 3493, Estación Central, Chile
e-mail: This email address is being protected from spambots. You need JavaScript enabled to view it.
2
Center for Interdisciplinary Research in Astrophysics and Space Sciences (CIRAS), Universidad de Santiago de Chile, Chile
3
Núcleo de Astroquímica, Facultad de Ingeniería, Universidad Autónoma de Chile, Av. Pedro de Valdivia 425, Providencia, Santiago, Chile
4
Department of Physics and Astronomy, Haverford College, 370 Lancaster Avenue, Haverford, PA 19041, USA
5
Centre for Astrophysics and Supercomputing, Swinburne University of Technology, John St, Hawthorn, VIC 3122, Australia
6
Department of Astronomy and Cornell Center for Astrophysics and Planetary Science, Cornell University, Ithaca, NY 14853, USA
Received:
5
November
2021
Accepted:
17
November
2021
Abstract
Context. The characteristic age of PSR J1734−3333 estimated from its current spin down rate implies that it is a young pulsar (τc = 8.1 kyr). However, the time derivative of its spin-down rate differs markedly from that assumed for normal radio pulsars, meaning its actual age is uncertain. G354.8−0.8 is a supernova remnant (SNR) whose centre is located 21′ away from the pulsar, and which has a morphology that suggests an association with the pulsar.
Aims. We aim to assess the likelihood of the association between PSR J1734−3333 and G354.8−0.8 or other nearby SNRs quantitatively, with the objective of shedding light on the real age of this pulsar.
Methods. Observations with the Karl G. Jansky Very Large Array were carried out in 2015 and 2019 that allow precise astrometric measurements and consequently a proper motion estimate for the pulsar.
Results. The proper motion was found to be μα = 10 ± 10 mas yr−1 and μδ = −29 ± 11 mas yr−1 (error bars are 1-σ). Though marginal, this detection rules out the association with G354.8−0.8 because it means the pulsar is not moving away from the centre of the SNR. No SNR consistent with the measured proper motion and an age τc could be found. We also present the first measurement of the spectral index for this pulsar, α = −1.1 ± 0.3, measured between 1.5 and 3.0 GHz.
Conclusions. The SNR produced by the birth supernova of PSR J1734−3333 could have already faded to undetectable brightness, estimates of which suggest timescales of 10 − 100 kyr. This and other considerations lead us to conclude that the pulsar is possibly older than 45 − 100 kyr. PSR J1734−3333 is a pulsar with rotational properties that place it between standard radio pulsars and magnetars, and we interpret our result in the context of a possible future life as a magnetar for this pulsar.
Key words: stars: neutron / pulsars: general / pulsars: individual: PSR J1734−3333 / proper motions / ISM: supernova remnants
© ESO 2022
1. Introduction
The age of a neutron star is difficult to measure, as for many other astronomical sources. The most robust way to do it is by identifying the birth supernova of the neutron star. However, this can be done precisely only for a very small number of objects, as 5–10 supernovae have historically been observed in our galaxy (Stephenson & Green 2005), and neutron stars are faint sources–practically undetectable at distances beyond the Magellanic Clouds. The explosions, however, leave imprints in the interstellar medium that can remain visible at radio wavelengths for 10 − 100 kyr (Sarbadhicary et al. 2017), thereby allowing the association of pulsars with supernova remnants (SNRs). However, pulsars are rarely found at the centre of SNRs (Frail et al. 1994), as most are expelled like bullets during the explosions possibly due to asymmetries in the process (e.g. Socrates et al. 2005). The transverse velocities of pulsars (based on proper motion and distance estimates) are particularly large, with a mean close to 310 km s−1 (Hobbs et al. 2005), which is at least ten times larger than the average velocities for stars in the solar neighbourhood (e.g. Gaia Collaboration 2018). Moreover, some measured velocities range as high as 1000 km s−1 (Chatterjee et al. 2005; Deller et al. 2019). Thus, associations between SNRs and pulsars are not always straightforward to make (e.g. see the chapter on young pulsars in Lyne & Graham-Smith 2012). The farther the pulsar is from the explosion site, the higher the possibility that the pulsar and SNR are unrelated. In order to confirm an association, it could be necessary to account for up to 100 kyr of evolution of the SNR (that we assume as the maximum possible age of a SNR), and movement across the Galaxy of the pulsar (e.g. Suzuki et al. 2021). In some situations, proper motion measurements for the pulsars can shed light on the matter. For an association to be secure, the pulsar must be moving away from where the explosion took place (usually adopted as the centre of the SNR), and the time necessary to move the pulsar to its current position must match the age of the system. If such time coincided with an independent age measurement of the SNR or the pulsar, or both, then the association would be concretely confirmed. However, this is rarely possible as SNR and pulsar ages are hard to obtain.
In this paper, we present interferometric observations of PSR J1734−3333 designed to measure its proper motion, evaluate its possible connection with the shell-type SNR G354.8−0.8 (Whiteoak & Green 1996; Green 2014), and, if possible, constrain the age of the pulsar. This association was first proposed by Manchester et al. (2002) based on the proximity of the two objects and the fact that the SNR exhibits a teardrop shape oriented towards the pulsar. Yet, given that the evidence is circumstantial and that the pulsar is 21′ away from the centre of the SNR, the association was not considered secure (Manchester et al. 2002). No estimates for the distance of SNR G354.8 − 0.8 are available. While confirming this association is in itself important, PSR J1734−3333 possesses some other interesting properties, such as a decreasing characteristic age and a potential future as a magnetar, which add relevance to the proper motion measurement that we present.
Another common way to estimate the age of a pulsar is by measuring its period P and period time derivative Ṗ, then assume a spin-down law, and calculate the time required to reach the current value of P. Typically, the rotation is believed to be slowed down by magnetic dipole radiation, which implies Ṗ ∝ P−1 for a constant dipole magnitude. If, additionally, the initial period P0 is assumed to have been significantly shorter than today’s value, that is if (P0/P)2 ≪ 1, then the age is given by τc = P/2Ṗ, which is known as the characteristic age (e.g. Manchester & Taylor 1977; Lyne & Graham-Smith 2012). However, the caveats involved can sometimes be enough to make this age definition unreliable.
PSR J1734−3333 rotates with a typical period P = 1.169 s, but it slows down with the fourth largest period derivative amongst pulsars (Ṗ = 2.3 × 10⁻¹², Morris et al. 2002; Manchester et al. 2005). These measurements imply the particularly young characteristic age τc = 8.1 kyr. However, a measurement of the second derivative of the spin period indicates that the rotation of this pulsar may not be driven by constant magnetic dipole braking.
The braking index (n) is used to characterise the long-term rotational evolution of pulsars and is defined from the relation Ṗ ∝ P2−n (e.g. Manchester & Taylor 1977; Lyne & Graham-Smith 2012). Pulsars evolving purely under the effects of magnetic dipole braking are expected to exhibit a braking index of 3. However, measurements point to either n < 3 in very young pulsars such as PSR J1734−3333 or to 10 ≤ n ≤ 100 for cases possibly affected by timing noise or glitch recoveries (Parthasarathy et al. 2020). To measure the braking index, it is necessary to detect the period second derivative, which is a fairly small quantity, and hence difficult to detect (Espinoza et al. 2017). In the case of PSR J1734−3333, two independent measurements indicate that n is in the 0.7–1.4 range, one of the lowest braking indices ever measured (Espinoza et al. 2011; Lower et al. 2021). Such a low braking index carries some consequences, among which is the fact that the characteristic age is either decreasing (if n < 1), or increasing very slowly with time (if n ≳ 1, Lyne 2004). Therefore, τc is a highly unreliable proxy for the age of this pulsar, which implies that PSR J1734−3333 could be substantially older than 8.1 kyr.
Both P and Ṗ measurements enable the inference of the amplitude of the effective dipole magnetic field responsible for the slow down, should magnetic dipole radiation be the dominant braking mechanism (e.g. Manchester & Taylor 1977). It corresponds to B = 3.2 × 10¹⁹(PṖ)1/2, where standard assumptions regarding the orientation of the dipole and the size of the star have been made, and for PSR J1734−3333 amounts to B = 5.2 × 10¹³ G, which is the fourth largest magnetic field strength known among pulsars (The ATNF Pulsar Catalogue, Manchester et al. 2005)1 and is higher than the inferred values for at least three of the approximately 30 known magnetars (The McGill Online Magnetar Catalog, Olausen & Kaspi 2014)2. Magnetars are a class of neutron stars, which emit in the X-rays and are identified by their luminous X-ray and soft γ-ray outburst episodes that usually require more power than is available in the rotation of the star. They rotate with periods in the 2–12 s range, which is slower than most pulsars, and they slow down quicker than all pulsars (with the notable exception of three sources with relatively low-Ṗ values, Rea et al. 2010, 2012, 2014). Both the high Ṗ values and the high energy emission of magnetars are believed to be driven and powered by the decay of very intense magnetic fields of 1014 − 15 G (e.g. Woods & Thompson 2006; Mereghetti et al. 2015; Kaspi & Beloborodov 2017). This is in opposition with most other, rotation-powered pulsars that rotate faster, have lower dipole field strengths, exhibit modest and stable X-ray emission (if any), and are observed mostly in radio wavelengths.
PSR J1734−3333 is a normal radio pulsar with standard X-ray emission properties, unlike the magnetars (though there is a debate on whether the pulsar is hotter than others of similar τc, see Olausen et al. 2013; Keane et al. 2013). However, its very low braking index implies that its rotational properties are evolving quickly towards those of the magnetars. In ∼30 kyr, if the braking index remains low, the pulsar will rotate with a period of 8 s, and the dipole magnetic field strength B inferred from the pulsar spin-down would be comparable to that for magnetars (Espinoza et al. 2011).
The separation between magnetars and rotation-powered pulsars has indeed become less clear as new neutron stars have been discovered (e.g. Hu et al. 2020) and observations of previously known pulsars have accumulated. High-B, rotation-powered pulsars have been seen to turn into magnetars for a few months (see the X-ray outbursts of PSRs J1846−0258 and J1119−6127, Gavriil et al. 2008; Kuiper & Hermsen 2009; Archibald et al. 2016), and some magnetars have been seen to awaken in the radio band during or after outbursts (e.g. Camilo et al. 2006, 2007; Eatough et al. 2013). Therefore, it is possible that some high-B pulsars are dormant magnetars, which could display full magnetar high-energy behaviour at any time. We note that there is not a single rotation-powered pulsar known with the rotational properties of magnetars: large periods and period derivatives. Thus, PSR J1734−3333, with its high Ṗ, could be an evolutionary link between the two classes of pulsars. Collectively, these facts make its age, proper motion, and relationship with SNR G354.8−0.8 particularly relevant. Evolutionary links between neutron star families are one possible solution to explain the overabundance of neutron stars in the Galaxy with respect to the rate of supernova explosions (Keane & Kramer 2008).
2. Data
We used the VLA on two epochs separated by approximately 4.2 yr to image the field of PSR J1734−3333 and constrain its proper motion.
2.1. Observations
The first observations were carried out on 24 May 2015, using the BnA VLA configuration. This configuration was chosen due to the low declination (−33°) of the pulsar, which at the observatory site translates to a maximum elevation of ∼20°. On this occasion, the observations were done on a single pointing using both the L (1–2 GHz) and S (2–4 GHz) bands. The second observation was carried out only at the S band, on 21 August 2019. After 2015, the BnA configuration was not offered anymore, and hence we used the A configuration for the second observation. Table 1 lists a summary of the observations.
Log of observations.
For both observation epochs, the primary calibrator was 3C286 (flux density and bandpass), and the secondary calibrator was J1713−3226 (for phase). The data were calibrated following standard procedures using the VLA calibration pipeline that is built on the Common Astronomy Software Applications (CASA, McMullin et al. 2007) versions 4.4.2 and 5.4.2. After an initial calibration run, we manually inspected the resulting visibilities and calibration tables in order to search for problematic data (either Radio Frequency Interference (RFI) or instrumental). RFI was present in the S-band data at both observations of both epochs. After the removal of the problematic visibilities, we reran the calibration pipeline and iterated the entire process until no signs of bad data were detected. The flagged data in S-band accounts for ∼20% and ∼14% of the on-time sources for the 2015 and 2019 data, respectively.
After calibration, we used the TCLEAN task from CASA (version 5.8) to image the measurement sets for each epoch. We tested several weighting and imaging parameters, and we settled for the ones that provided better sensitivity and a lower level of imaging artefacts. We chose the Briggs weighting scheme (Briggs et al. 1999) with ROBUST = 0.5 in order to find a balance between good signal-to-noise ratio (S/N) and a narrow synthesised beam. Also, we used the NTERMS = 2 option, which allows the TCLEAN task to model the spectral indices of the sources. We created images using a large grid of 13122 × 13122 square pixels, each with a side of 0.1 arcsec. This image size is roughly 1.5 times the primary beam at S-band, motivated by the intention of also including sources that lie farther away from the position of the pulsar in the analysis. Because of the large image size, we had to use the wide-field imaging parameters GRIDDER=wproject and WPROJECTPLANES = −1.
Due to the different array configurations for each epoch, the 2019 data have a more elongated synthesised beam (see Table 1). Figure 1 shows the 2015 S-band image for the pulsar and for the three brighter sources in the field. Contours of the 2019 S-band observation are overlaid.
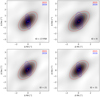 |
Fig. 1. Clean S-band images for the four brighter sources in the 2015 observation. Overlaid contours for the 2015 (red) and the 2019 (blue) observations are shown too. The pulsar is source 17 (top left). |
2.2. Source detection and astrometry
After we produced cleaned images for each epoch, we used an automatic source detection software (the DAOSTARFINDER routine from the PHOTUTILS package3) to identify all the sources that could be used to reference the position of the pulsar. This procedure yielded a total of 41 sources that were detected in both epochs. From these sources, a number of them were complex, meaning they were resolved in the 2019 data but unresolved in the 2015 maps (due to the difference in beam sizes) while others were resolved and showed extended emission in both epochs. We kept only the ones that were consistent with being unresolved point sources in both epochs. The final number of sources that we used to measure their positions was N = 21.
We measured the positions of the selected sources using the IMFIT task from CASA. The task fits a 2D Gaussian for each source where the free parameters are the location of the centroid, both semi-axis and its position angle. In Tables 2 and 3, we list the parameters for the sources, including the pulsar, for both epochs. In these tables, the ID number is the index of the source from the original 41 sources detected by DAOSTARFINDER. We also list the flux density of each source, its S/N based on the rms noise of the maps, the distance to the coordinates of the pulsar as previously published in Espinoza et al. (2011, RA(J2000) = 17h34m26.9s, Dec(J2000) = −33d33m20s,) and the RA-Dec coordinates with their respective 1-σ uncertainty as calculated by IMFIT. The listed flux densities have not been corrected by the primary beam attenuation. In these tables, the pulsar corresponds to ID = 17.
Source parameters from the 2015 map obtained with the CASA routine IMFIT.
3. Proper motion estimate
At each epoch, we measured the position of the pulsar and the point-like background sources listed in Tables 2 and 3. We assume that the proper motion of all these background sources is zero, and we used that constraint to measure a single offset, ΔC, between the two observations. The ensemble of background sources (or reference sources) is characterised via its centroid, which is the average of their positions at a given epoch: C = (⟨α⟩,⟨δ⟩). Thus the offset of the centroid is ΔC = C2019 − C2015. This quantity is used to minimise the net translation that this ensemble of sources may present between the two observations. The effective displacement of the pulsar between the two epochs is the position difference between the 2019 and 2015 observations, Δp, corrected by ΔC:
 (1)
(1)
Source parameters from the 2019 map obtained with the CASA routine IMFIT.
The uncertainty of D was calculated by propagating the uncertainties of Δp and ΔC. To calculate the uncertainty of Δp, the error bars reported by IMFIT (Tables 2 and 3) were added in quadrature. The uncertainty of ΔC was calculated by adding the uncertainty of C2015 and C2019 in quadrature, where each of them was measured using a bootstrap method (Efron & Tibshirani 1991). In this method, several realisations (500 000 in this case) of the calculation of ΔC were done using samples of reference sources that were variations of the original sample of N sources (in this case, the N = 21 sources in Tables 2 and 3). Each varied sample was generated by selecting N reference sources randomly from the original list of N sources; we note that any source could be selected more than once in a given realisation. The standard deviation of all the offsets was defined as the uncertainty of the centroid offset calculated from the original sample.
Using the 21 reference sources in Tables 2 and 3, we obtained a displacement for the pulsar in RA of  , and a displacement in Dec of
  (Table 4). Figure 2 plots the offset in RA and Dec for the sources listed in Tables 2 and 3. The offsets between epochs of some individual sources can be significantly different to the centroid’s offset, and sometimes even larger than the offset of the pulsar. For example, source 18 has particularly large residuals, as can be seen in the top panel of Fig. 2, which are probably due to its own proper motion. In order to test the effect of this large shift in position of individual sources, we experimented by removing the reference sources with large residuals and calculated everything again. The results obtained for most combinations were consistent (considering uncertainties) with the results described above: a marginal detection of the pulsar displacement in Dec (of negative sign) and a non-detection of the pulsar displacement in RA. As an example, in Table 4 and Fig. 2 (bottom) we present the results obtained when using only the 17 sources with offsets that lie within the standard deviation of the entire sample (that is, between the dotted lines in the top plots in Fig. 2). The difference in the resulting proper motion estimate when using both samples is consistent with zero. These results indicate that both the reference frame and the measured proper motion for the pulsar are robust.
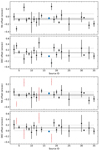 |
Fig. 2. Offsets between the positions measured in 2015 and 2019 of the sources in Tables 2 and 3. The pulsar is source 17 and its offset (Δp) is plotted with a blue square. The centroid’s offset and the standard deviation of the reference sources around this value are shown with horizontal dotted lines. The grey area in each plot is the uncertainty of the centroid’s offset, as calculated using a bootstrap method. Top: results for RA and Dec obtained for 21 reference sources. Bottom: results obtained for the 17 reference sources that present offsets consistent with that of the centroid’s. The rejected sources are plotted with smaller red symbols and were not used to measure the centroid (see Table 4). |
Offsets and displacements for two sets of reference sources.
Distributions of the proper motion components μα and μδ, for the analysis that uses 17 reference sources, are shown in Fig. 3. Each value comes from a measurement of D performed via a particular realisation of the frame of reference (using the bootstrap process described above) and the pulsar offset Δp. For Δp, we drew values from normal distributions centred at the RA and Dec offset components presented in Table 4 and with dispersions equal to the quoted uncertainties. We note that the distribution for μδ is wider mainly because of the orientation of the elongated beam shape in the 2019 observation, which covers a longer range in Dec than in RA (Fig. 1). The proper motions were calculated for a difference in time of 4.2433 yr between observations. Our results are consistent with a motion of the pulsar between both epochs only in Dec, which implies a proper motion μδ = −29 ± 11 mas yr−1. We acknowledge that this is a marginal detection, as the displacement of the pulsar in Dec is similar to the standard deviation of the other sources’ displacements (see the horizontal dotted lines in Fig. 2).
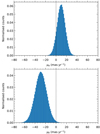 |
Fig. 3. Pulsar proper motion values obtained from realisations of both the centroid of 17 reference sources (from the bootstrap method) and the pulsar offset Δp (using a Gaussian distribution centred at the measured value and with a dispersion given by its uncertainty, Table 4). |
4. A complicated association with G354.8−0.8
If PSR J1734−3333 and SNR G354.8−0.8 were associated, the proper motion of the pulsar would be −172 mas yr−1 in RA and 64 mas yr−1 in Dec, assuming an age of 8.1 kyr (the characteristic age of the pulsar) and that it has travelled with constant velocity since the explosion. From our results, we can write the 2-σ limits −10 < μα < 30 mas yr−1 (Fig. 3, Table 4), which is inconsistent with the expected −172 mas yr−1 at high significance. In declination, our detection μδ = −29 ± 11 mas yr−1 is also significantly inconsistent with the expectation, and implies movement of the pulsar but towards the SNR. These results therefore indicate that the pulsar and G354.8–0.8 are not related, meaning that the original SNR that was born with the pulsar might have faded and the system may be older than 10–100 kyr.
We note that μδ = −29 ± 11 mas yr−1 implies a transverse velocity of 630 ± 210 km s−1 (at a distance d4.5 = 4.5 kpc, as estimated from the dispersion measure and the YMW16 electron density model, Yao et al. 2017), which is faster than the average transverse speed among pulsars but still a possible value. The distance to the pulsar is, however, rather uncertain, as it depends on the model used for the electron density column. The NE2001 model (Cordes & Lazio 2002) indicates that the distance is d6.1 = 6.1 kpc. This distance would imply a speed of 870 ± 290 km s−1, which lies at the very high end of the distribution of pulsar transverse velocities (Hobbs et al. 2005). However, the possibility that the marginal detection of μδ is a statistical fluke cannot be completely neglected. Hence, we also consider the possibility that the proper motion of the pulsar is below our detection capabilities, and consider a 2-σ upper limit for the total proper motion μ < 28 mas yr−1, obtained by doubling the calculated uncertainties in RA and Dec. Given this proper motion constraint, if the pulsar and SNR were indeed associated, the pulsar would need at least 45 kyr to cover the distance determined by the 21′ offset with the SNR centre. If the system were older than 45 kyr, as required by this upper limit scenario and for a true SNR-pulsar association, the pulsar transverse velocity would be less than 590 d/d4.5 km s−1, where d is the assumed distance to the pulsar. This is, however, an unlikely scenario given the results of our observations, which suggest that the pulsar moves in a direction 130° away from what the association with the SNR requires (with a measured position angle error of 16°, this is a 8-σ distance in position angle).
Is there another SNR candidate? Figure 4 shows the known SNRs that lie in the vicinity of PSR J1734−3333. Their positions were taken from the Green (2019) catalogue of supernova remnants. We also searched for SNRs detected at lower radio wavelengths, which are hence potentially older than those detected at shorter wavelengths (Roy & Bhatnagar 2006; Hurley-Walker et al. 2019), but we found none near the pulsar. In Fig. 4, regions that show where the pulsar was in the past are plotted, based on the proper motion we obtained. Just by considering the direction of the proper motion, it is tempting to consider either G355.6−00.0 or G355.4+00.7 as candidates to the associated SNR for the pulsar. In terms of the direction, this is plausible given that μα is essentially unconstrained by our data. However, the large separation between the PSR and both SNRs makes the association unlikely, as it would require an age for the SNRs greater than 100 kyr, and it is unlikely that SNRs remain detectable in the radio for this long (Sarbadhicary et al. 2017). Moreover, G355.6+00.0 is believed to lie at a distance of around 12 kpc, albeit with large uncertainties (Case & Bhattacharya 1998; Minami et al. 2013), which is much larger than what it is estimated for the pulsar. For this remnant, the age is estimated to be ∼20 kyr by Minami et al. (2013) and 9 ± 1.7 kyr by Leahy et al. (2020), considerably less than what is required to be associated with PSR J1734−3333.
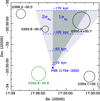 |
Fig. 4. Supernova remnants in the vicinity of PSR J1734−3333. The black circles represent SNRs from the Green (2019) catalogue, and SNR G354.8−0.8 is in green. The diameter of each circle is given by the size of the SNR listed in the catalogue. The blue dot shows the current location of the pulsar, and the horizontal dashed lines show where the pulsar would have been at each labelled time in the past considering a proper motion μδ = −29 mas yr−1. The shaded regions mark the possible location of the pulsar in the past considering also a proper motion in RA, for which we used the 1-σ range μα ∈ [0, 20] mas yr−1 (dark shading) and the 2-σ range μα ∈ [ − 10, 30] mas yr−1 (light shading). |
5. Radio spectral index
Besides the astrometry analysis of the sources using the S-band of the VLA, we also observed the field in L-band during the 2015 epoch. This allows for the measurement of the spectral index of the pulsar.
The spectral index for pulsars is defined from a relation between the radio flux density S and the observing frequency f, given by S ∝ fα. Using the 2015 observation in the L band, we measured a flux density for PSR J1734−3333 of 710 ± 70 μJy, centred at 1.5 GHz. Combining this with the S-band (3.0 GHz) 2015 measurement of 344 ± 8 μJy (Table 2), we obtain a spectral index of α = −1.1 ± 0.3. The flux density of the pulsar in the S band does not change significantly between 2015 and 2019, so this result is the same if the S-band measurement from 2019 was used instead. A spectral index of −1.1 is higher but still consistent with values measured for other normal pulsars, which exhibit a mean between −1.8 and −1.6 (Toscano et al. 1998; Maron et al. 2000; Jankowski et al. 2018). Thus, the spectrum of PSR J1734−3333 is somewhat flatter than the spectra of most other radio pulsars. Magnetars, on the other hand, when detected in the radio exhibit flat radio spectra (in general α > −0.8 for the magnetars, e.g. Huang et al. 2021).
6. Discussion
Interferometric observations of PSR J1734−3333 were performed on two epochs separated by 4.2 yr. Astrometric measurements and comparison of both images allow a marginal detection of the proper motion, μα = 10 ± 10 mas yr−1 and μδ = −29 ± 11 mas yr−1, which indicates that the pulsar and SNR G354.8−0.8 are not related. We also consider a scenario in which this detection is not real and assume an upper limit on the total proper motion of μ < 28 mas yr−1. Both scenarios suggest that the pulsar is older than 45–100 kyr, which can be compared to its characteristic age of only 8.1 kyr.
The spectral index that we measured is flatter than what is found for most pulsars and approaches those measured for the six magnetars detected at radio wavelengths. Thus, not only the rotational properties but also some aspects of the radio emission of PSR J1734−3333 resemble magnetar properties. If one day PSR J1734−3333 displays magnetar-like, high-energy behaviour, then it will be evident that other magnetars also had a past life as radio pulsars and are much older than what has usually been assumed. In the likely scenario that magnetars are powered by intense magnetic fields –and assuming that spin-down-based measurements can reliably be used to estimate B in this type of object, what physical mechanism could make high-B pulsars evolve into even-higher-B magnetars?
While the X-ray properties of PSR J1734−3333 are unremarkable in general, the temperature measured from those observations suggests that it may be hotter than other pulsars of similar τc, though not as hot as the magnetars (Olausen et al. 2013; Keane et al. 2013). If the pulsar was older than 45 kyr, then its temperature would be particularly high for its age, thereby supporting the idea that the magnetic field could be evolving quickly in this pulsar (the amplitude of its surface magnetic dipole component increasing; Muslimov & Page 1996; Espinoza et al. 2011; Ho 2011, 2015) and generating additional heat (e.g. Kaminker et al. 2006; Ho et al. 2012; De Grandis et al. 2020). Such an evolution could be caused by the emergence of a field that was buried by accretion from a short-lived fall-back disc after the supernova explosion (Chevalier 1989; Bernal et al. 2013). There are calculations that relate pulsar proper motions with the rate of magnetic field growth, which in turn is related to the braking index (Guneydas & Eksi 2013). For PSR J1734−3333, this model could accommodate transverse speeds of up to ∼500 km s−1, which is somewhat slower than our measurement. An alternative scenario is that the spin evolution of the pulsar has been driven by accretion from a permanent fallback disc, for which models predict a pulsar age in a similar range to the one we obtain (Çalişkan et al. 2013; Liu et al. 2014). In this model, magnetars are not powered by the decay of very powerful magnetic fields, but by accretion (Çalışkan & Ertan 2012). More timing observations to monitor the braking index and more sensitive X-ray studies will help to assess the likelihood of the above scenarios and understand the future of PSR J1734−3333.
Acknowledgments
C.M.E acknowledges support by ANID FONDECYT/Regular grant 1211964. M.V-N. acknowledges support by ANID FONDECYT grant 11191205.
References
- Archibald, R. F., Kaspi, V. M., Tendulkar, S. P., & Scholz, P. 2016, ApJ, 829, L21 [NASA ADS] [CrossRef] [Google Scholar]
- Bernal, C. G., Page, D., & Lee, W. H. 2013, ApJ, 770, 106 [NASA ADS] [CrossRef] [Google Scholar]
- Briggs, D. S., Schwab, F. R., & Sramek, R. A. 1999, in Synthesis Imaging in Radio Astronomy II, eds. G. B. Taylor, C. L. Carilli, & R. A. Perley, ASP Conf. Ser., 180, 127 [Google Scholar]
- Çalışkan, Ş., & Ertan, Ü. 2012, ApJ, 758, 98 [CrossRef] [Google Scholar]
- Çalişkan, Ş., Ertan, Ü., Alpar, M. A., Trümper, J. E., & Kylafis, N. D. 2013, MNRAS, 431, 1136 [CrossRef] [Google Scholar]
- Camilo, F., Ransom, S. M., Halpern, J. P., et al. 2006, Nature, 442, 892 [NASA ADS] [CrossRef] [Google Scholar]
- Camilo, F., Ransom, S. M., Halpern, J. P., & Reynolds, J. 2007, ApJ, 666, L93 [NASA ADS] [CrossRef] [Google Scholar]
- Case, G. L., & Bhattacharya, D. 1998, ApJ, 504, 761 [NASA ADS] [CrossRef] [Google Scholar]
- Chatterjee, S., Vlemmings, W. H. T., Brisken, W. F., et al. 2005, ApJ, 630, L61 [NASA ADS] [CrossRef] [Google Scholar]
- Chevalier, R. A. 1989, ApJ, 346, 847 [Google Scholar]
- Cordes, J. M., & Lazio, T. J. W. 2002, ArXiv e-prints [arXiv:astro-ph/0207156] [Google Scholar]
- De Grandis, D., Turolla, R., Wood, T. S., et al. 2020, ApJ, 903, 40 [NASA ADS] [CrossRef] [Google Scholar]
- Deller, A. T., Goss, W. M., Brisken, W. F., et al. 2019, ApJ, 875, 100 [NASA ADS] [CrossRef] [Google Scholar]
- Eatough, R. P., Falcke, H., Karuppusamy, R., et al. 2013, Nature, 501, 391 [Google Scholar]
- Efron, B., & Tibshirani, R. 1991, Science, 253, 390 [NASA ADS] [CrossRef] [Google Scholar]
- Espinoza, C. M., Lyne, A. G., Kramer, M., Manchester, R. N., & Kaspi, V. M. 2011, ApJ, 741, L13 [NASA ADS] [CrossRef] [Google Scholar]
- Espinoza, C. M., Lyne, A. G., & Stappers, B. W. 2017, MNRAS, 466, 147 [NASA ADS] [CrossRef] [Google Scholar]
- Frail, D. A., Goss, W. M., & Whiteoak, J. B. Z. 1994, ApJ, 437, 781 [Google Scholar]
- Gaia Collaboration (Katz, D., et al.) 2018, A&A, 616, A11 [NASA ADS] [CrossRef] [EDP Sciences] [Google Scholar]
- Gavriil, F. P., Gonzalez, M. E., Gotthelf, E. V., et al. 2008, Science, 319, 1802 [NASA ADS] [CrossRef] [Google Scholar]
- Green, D. A. 2019, A&A, 40, 36 [Google Scholar]
- Green, D. A. 2014, Bull. Astron. Soc. India, 42, 47 [NASA ADS] [Google Scholar]
- Guneydas, A., & Eksi, K. Y. 2013, MNRAS, 430, L59 [NASA ADS] [CrossRef] [Google Scholar]
- Ho, W. C. G. 2011, MNRAS, 414, 2567 [NASA ADS] [CrossRef] [Google Scholar]
- Ho, W. C. G. 2015, MNRAS, 452, 845 [NASA ADS] [CrossRef] [Google Scholar]
- Ho, W. C. G., Glampedakis, K., & Andersson, N. 2012, MNRAS, 422, 2632 [NASA ADS] [CrossRef] [Google Scholar]
- Hobbs, G., Lorimer, D. R., Lyne, A. G., & Kramer, M. 2005, MNRAS, 360, 974 [Google Scholar]
- Hu, C.-P., Begiçarslan, B., Güver, T., et al. 2020, ApJ, 902, 1 [NASA ADS] [CrossRef] [Google Scholar]
- Huang, Z.-P., Yan, Z., Shen, Z.-Q., et al. 2021, MNRAS, 505, 1311 [NASA ADS] [CrossRef] [Google Scholar]
- Hurley-Walker, N., Filipović, M. D., Gaensler, B. M., et al. 2019, PASA, 36, e045 [NASA ADS] [CrossRef] [Google Scholar]
- Jankowski, F., van Straten, W., Keane, E. F., et al. 2018, MNRAS, 473, 4436 [Google Scholar]
- Kaminker, A. D., Yakovlev, D. G., Potekhin, A. Y., et al. 2006, MNRAS, 371, 477 [NASA ADS] [CrossRef] [Google Scholar]
- Kaspi, V. M., & Beloborodov, A. M. 2017, ARA&A, 55, 261 [Google Scholar]
- Keane, E. F., & Kramer, M. 2008, MNRAS, 391, 2009 [Google Scholar]
- Keane, E. F., McLaughlin, M. A., Kramer, M., et al. 2013, ApJ, 764, 180 [NASA ADS] [CrossRef] [Google Scholar]
- Kuiper, L., & Hermsen, W. 2009, A&A, 501, 1031 [NASA ADS] [CrossRef] [EDP Sciences] [Google Scholar]
- Leahy, D. A., Ranasinghe, S., & Gelowitz, M. 2020, ApJS, 248, 16 [NASA ADS] [CrossRef] [Google Scholar]
- Liu, X.-W., Xu, R.-X., Qiao, G.-J., Han, J.-L., & Tong, H. 2014, Res. Astron. Astrophys., 14, 85 [Google Scholar]
- Lower, M. E., Johnston, S., Dunn, L., et al. 2021, MNRAS, 508, 3251 [NASA ADS] [CrossRef] [Google Scholar]
- Lyne, A. G. 2004, in Young Neutron Stars and Their Environments, eds. F. Camilo, & B. M. Gaensler, 218, 257 [NASA ADS] [Google Scholar]
- Lyne, A., & Graham-Smith, F. 2012, Pulsar Astronomy (Cambridge, UK: Cambridge University Press) [CrossRef] [Google Scholar]
- Manchester, R. N., & Taylor, J. H. 1977, Pulsars (San Francisco, USA: W. H. Freeman and Company) [Google Scholar]
- Manchester, R. N., Bell, J. F., Camilo, F., et al. 2002, in Neutron Stars in Supernova Remnants, eds. P. O. Slane, & B. M. Gaensler, ASP Conf. Ser., 271, 31 [NASA ADS] [Google Scholar]
- Manchester, R. N., Hobbs, G. B., Teoh, A., & Hobbs, M. 2005, AJ, 129, 1993 [Google Scholar]
- Maron, O., Kijak, J., Kramer, M., & Wielebinski, R. 2000, A&AS, 147, 195 [NASA ADS] [CrossRef] [EDP Sciences] [Google Scholar]
- McMullin, J. P., Waters, B., Schiebel, D., Young, W., & Golap, K. 2007, in Astronomical Data Analysis Software and Systems XVI, eds. R. A. Shaw, F. Hill, & D. J. Bell, ASP Conf. Ser., 376, 127 [Google Scholar]
- Mereghetti, S., Pons, J. A., & Melatos, A. 2015, Space Sci. Rev., 191, 315 [NASA ADS] [CrossRef] [Google Scholar]
- Minami, S., Ota, N., Yamauchi, S., & Koyama, K. 2013, PASJ, 65, 99 [NASA ADS] [CrossRef] [Google Scholar]
- Morris, D. J., Hobbs, G., Lyne, A. G., et al. 2002, MNRAS, 335, 275 [Google Scholar]
- Muslimov, A., & Page, D. 1996, ApJ, 458, 347 [NASA ADS] [CrossRef] [Google Scholar]
- Olausen, S. A., & Kaspi, V. M. 2014, ApJS, 212, 6 [Google Scholar]
- Olausen, S. A., Zhu, W. W., Vogel, J. K., et al. 2013, ApJ, 764, 1 [Google Scholar]
- Parthasarathy, A., Johnston, S., Shannon, R. M., et al. 2020, MNRAS, 494, 2012 [NASA ADS] [CrossRef] [Google Scholar]
- Rea, N., Esposito, P., Turolla, R., et al. 2010, Science, 330, 944 [NASA ADS] [CrossRef] [Google Scholar]
- Rea, N., Israel, G. L., Esposito, P., et al. 2012, ApJ, 754, 27 [NASA ADS] [CrossRef] [Google Scholar]
- Rea, N., Viganò, D., Israel, G. L., Pons, J. A., & Torres, D. F. 2014, ApJ, 781, L17 [NASA ADS] [CrossRef] [Google Scholar]
- Roy, S., & Bhatnagar, S. 2006, J. Phys. Conf. Ser., 54, 152 [NASA ADS] [CrossRef] [Google Scholar]
- Sarbadhicary, S. K., Badenes, C., Chomiuk, L., Caprioli, D., & Huizenga, D. 2017, MNRAS, 464, 2326 [NASA ADS] [CrossRef] [Google Scholar]
- Socrates, A., Blaes, O., Hungerford, A., & Fryer, C. L. 2005, ApJ, 632, 531 [Google Scholar]
- Stephenson, F. R., & Green, D. A. 2005, J. Hist. Astron., 36, 217 [NASA ADS] [CrossRef] [Google Scholar]
- Suzuki, H., Bamba, A., & Shibata, S. 2021, ApJ, 914, 103 [NASA ADS] [CrossRef] [Google Scholar]
- Toscano, M., Bailes, M., Manchester, R. N., & Sandhu, J. S. 1998, ApJ, 506, 863 [NASA ADS] [CrossRef] [Google Scholar]
- Whiteoak, J. B. Z., & Green, A. J. 1996, A&AS, 118, 329 [NASA ADS] [CrossRef] [EDP Sciences] [Google Scholar]
- Woods, P. M., & Thompson, C. 2006, Soft gamma repeaters and anomalous X-ray pulsars: magnetar candidates, 39, 547 [NASA ADS] [Google Scholar]
- Yao, J. M., Manchester, R. N., & Wang, N. 2017, ApJ, 835, 29 [NASA ADS] [CrossRef] [Google Scholar]
All Tables
All Figures
|
Fig. 1. Clean S-band images for the four brighter sources in the 2015 observation. Overlaid contours for the 2015 (red) and the 2019 (blue) observations are shown too. The pulsar is source 17 (top left). |
| In the text | |
|
Fig. 2. Offsets between the positions measured in 2015 and 2019 of the sources in Tables 2 and 3. The pulsar is source 17 and its offset (Δp) is plotted with a blue square. The centroid’s offset and the standard deviation of the reference sources around this value are shown with horizontal dotted lines. The grey area in each plot is the uncertainty of the centroid’s offset, as calculated using a bootstrap method. Top: results for RA and Dec obtained for 21 reference sources. Bottom: results obtained for the 17 reference sources that present offsets consistent with that of the centroid’s. The rejected sources are plotted with smaller red symbols and were not used to measure the centroid (see Table 4). |
| In the text | |
|
Fig. 3. Pulsar proper motion values obtained from realisations of both the centroid of 17 reference sources (from the bootstrap method) and the pulsar offset Δp (using a Gaussian distribution centred at the measured value and with a dispersion given by its uncertainty, Table 4). |
| In the text | |
|
Fig. 4. Supernova remnants in the vicinity of PSR J1734−3333. The black circles represent SNRs from the Green (2019) catalogue, and SNR G354.8−0.8 is in green. The diameter of each circle is given by the size of the SNR listed in the catalogue. The blue dot shows the current location of the pulsar, and the horizontal dashed lines show where the pulsar would have been at each labelled time in the past considering a proper motion μδ = −29 mas yr−1. The shaded regions mark the possible location of the pulsar in the past considering also a proper motion in RA, for which we used the 1-σ range μα ∈ [0, 20] mas yr−1 (dark shading) and the 2-σ range μα ∈ [ − 10, 30] mas yr−1 (light shading). |
| In the text | |
Current usage metrics show cumulative count of Article Views (full-text article views including HTML views, PDF and ePub downloads, according to the available data) and Abstracts Views on Vision4Press platform.
Data correspond to usage on the plateform after 2015. The current usage metrics is available 48-96 hours after online publication and is updated daily on week days.
Initial download of the metrics may take a while.