Free Access
Fig. 1.
Download original image
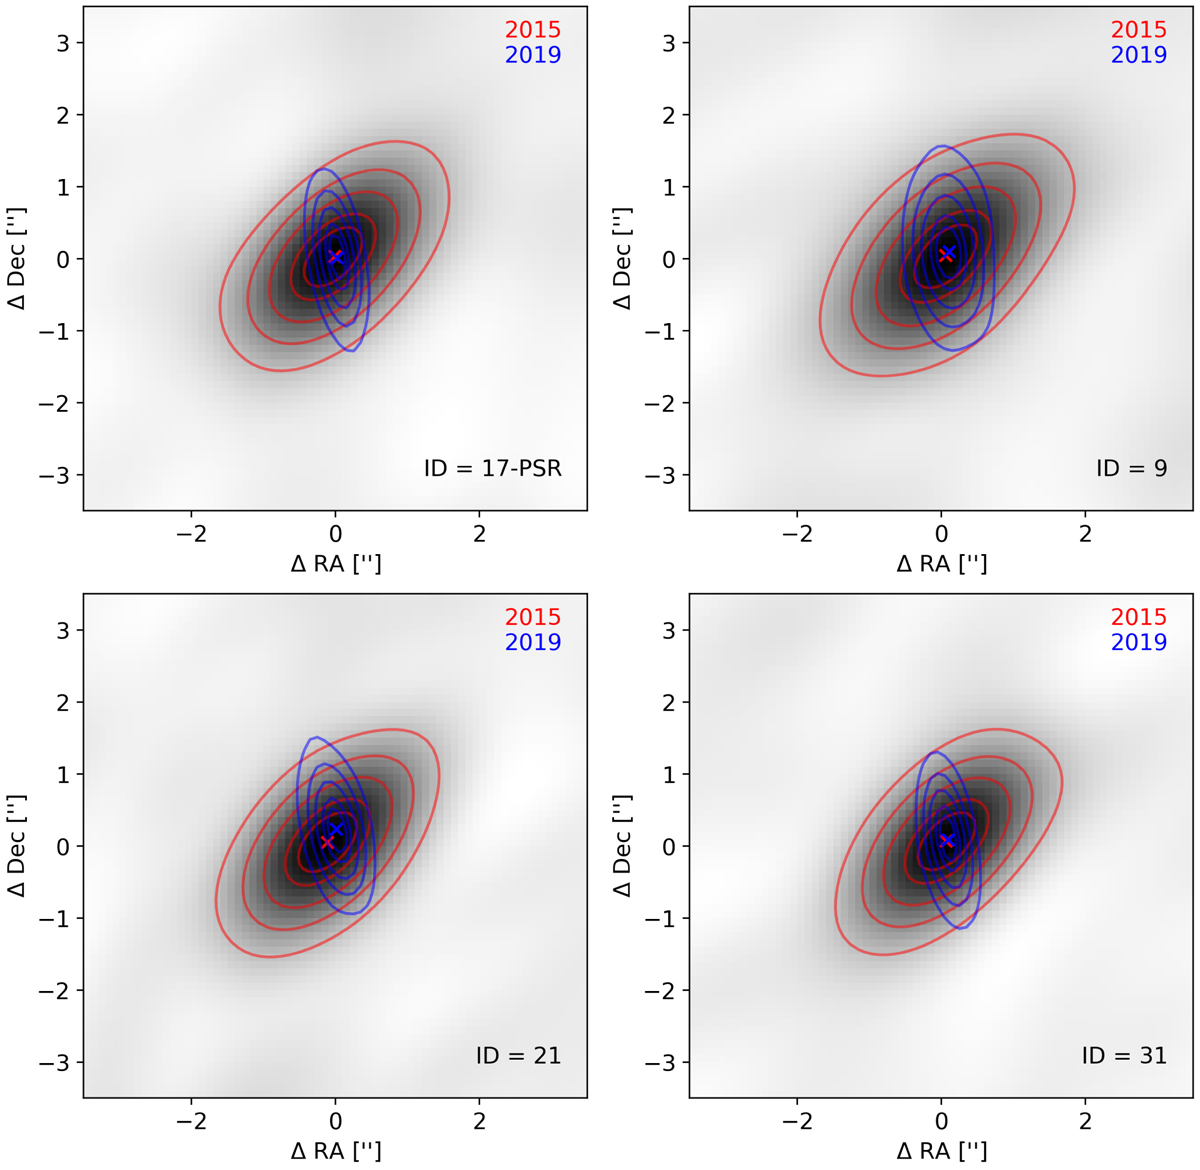
Clean S-band images for the four brighter sources in the 2015 observation. Overlaid contours for the 2015 (red) and the 2019 (blue) observations are shown too. The pulsar is source 17 (top left).
Current usage metrics show cumulative count of Article Views (full-text article views including HTML views, PDF and ePub downloads, according to the available data) and Abstracts Views on Vision4Press platform.
Data correspond to usage on the plateform after 2015. The current usage metrics is available 48-96 hours after online publication and is updated daily on week days.
Initial download of the metrics may take a while.