| Issue |
A&A
Volume 696, April 2025
|
|
|---|---|---|
| Article Number | A127 | |
| Number of page(s) | 14 | |
| Section | Stellar structure and evolution | |
| DOI | https://doi.org/10.1051/0004-6361/202453479 | |
| Published online | 15 April 2025 | |
The infrared counterpart and proper motion of magnetar SGR 0501+4516
1
European Space Agency (ESA), European Space Research and Technology Centre (ESTEC), Keplerlaan 1, 2201 AZ, Noordwijk, The Netherlands
2
Department of Astrophysics/IMAPP, Radboud University, PO Box 9010, 6500 GL Nijmegen, The Netherlands
3
Department of Physics, University of Warwick, Gibbet Hill Road, CV4 7AL Coventry, United Kingdom
4
European Space Agency (ESA), European Space Astronomy Centre (ESAC), Camino Bajo del Castillo s/n, 28692 Villanueva de la Cañada, Madrid, Spain
5
Astrophysics Research Cluster, School of Mathematical and Physical Sciences, University of Sheffield, Sheffield, S3 7RH
United Kingdom
6
Instituto de Astrofísica de Canarias, E-38205 La Laguna, Tenerife, Spain
7
Scuola Universitaria Superiore IUSS Pavia, Palazzo del Broletto, piazza della Vittoria 15, I-27100 Pavia, Italy
8
School of Physics, University College Dublin, L.M.I. Main Building, Beech Hill Road, Dublin 4, D04 P7W1
Ireland
9
Space Telescope Science Institute, 3700 San Martin Drive, Baltimore, MD, 21218
USA
10
AIM-CEA/DRF/Irfu/Département d’Astrophysique, CNRS, Université Paris-Saclay, Université de Paris Cité, Orme des Merisiers, F-91191 Gif-sur-Yvette, France
11
University of Maryland, Baltimore County, Baltimore, MD, 21250
USA
12
NASA Goddard Space Flight Center, Greenbelt, MD, 20771
USA
13
INAF-Osservatorio Astronomico di Roma, via Frascati 33, I-00078 Monte Porzio Catone, Italy
14
Department of Physics, The George Washington University, Corcoran Hall, 725 21st St NW, Washington, DC, 20052
USA
15
GWU/Astronomy, Physics and Statistics Institute of Sciences (APSIS), Washington DC, USA
16
INAF – Istituto di Astrofisica Spaziale e Fisica Cosmica Milano, via E. Bassini 15, 20133 Milano, Italy
17
Janusz Gil Institute of Astronomy, University of Zielona Góra, ul Szafrana 2, 65-265 Zielona Góra, Poland
18
Department of Physics and Astronomy, Stony Brook University, Stony Brook, NY, 11794-3800
USA
19
Institute of Space Sciences (ICE, CSIC), Campus UAB, Carrer de Can Magrans s/n, E-08193 Barcelona, Spain
20
Institut d’Estudis Espacials de Catalunya (IEEC), 08860 Castelldefels (Barcelona), Spain
21
Isaac Newton Group of Telescopes, Apartado de Correos 321, E-38700 Santa Cruz de La Palma, Canary Islands, Spain
22
School of Physics and Astronomy, University of Leicester, University Road, Leicester, LE1 7RH
United Kingdom
23
Centre for Astrophysics Research, University of Hertfordshire, College Lane, Hatfield, AL10 9AB
United Kingdom
24
Astrophysics Research Centre, Keele University, Keele, ST5 5BG
United Kingdom
25
Mullard Space Science Laboratory, University, College London, Holmbury St Mary, Dorking, Surrey, RH5 6NT
UK
⋆ Corresponding author; This email address is being protected from spambots. You need JavaScript enabled to view it.
Received:
17
December
2024
Accepted:
17
February
2025
Abstract
Aims. Soft gamma repeaters (SGRs) are highly magnetised neutron stars (magnetars) notable for their gamma-ray and X-ray outbursts. We used near-infrared (NIR) imaging of SGR 0501+4516 in the days, weeks, and years after its 2008 outburst to characterise the multi-wavelength emission, and to obtain a proper motion from our long temporal baseline observations.
Methods. We present short- and long-term monitoring of the IR counterpart of SGR 0501+4516 and a measurement of its proper motion. Unlike most magnetars, the source has only moderate foreground extinction with minimal crowding. Our observations began only ∼2 hours after the first activation of SGR 0501+4516 in August 2008 and continued for ∼4 years, including two epochs of Hubble Space Telescope (HST) imaging. The proper motion constraint was improved using a third HST epoch from 10 years later.
Results. The NIR and X-rays faded slowly during the first week, which was followed by a steeper power-law decay. The behaviour is satisfactorily fit by a broken power law. Three epochs of HST imaging with a 10-year baseline allowed us to determine the quiescent level and to measure a proper motion of μ = 5.4 ± 0.6 mas yr−1. This corresponds to a low transverse peculiar velocity of v ≃ 51 ± 14 km s−1 (at 2 kpc). The magnitude and direction of the proper motion rules out supernova remnant HB9 as the birth site. We can find no other supernova remnants or groups of massive stars within the region traversed by SGR 0501+4516 during its characteristic lifetime (∼20 kyr).
Conclusions. Our observations of SGR 0501+4516 suggest three possibilities: that some magnetars are significantly older than expected, that their progenitors produce low supernova ejecta masses, or that they can be formed through accretion-induced collapse or low-mass neutron star mergers. Although the progenitor of SGR 0501+4516 remains unclear, we propose that SGR 0501+4516 is the best Galactic candidate for a magnetar formed through a mechanism other than massive star core-collapse.
Key words: proper motions / stars: kinematics and dynamics / stars: magnetars / stars: neutron / stars: individual: SGR0501+4516 / ISM: supernova remnants
ESA Research Fellows.
Authors contributed equally.
© The Authors 2025
 Open Access article, published by EDP Sciences, under the terms of the Creative Commons Attribution License (https://creativecommons.org/licenses/by/4.0), which permits unrestricted use, distribution, and reproduction in any medium, provided the original work is properly cited.
This article is published in open access under the Subscribe to Open model. This email address is being protected from spambots. You need JavaScript enabled to view it. to support open access publication.
1. Introduction
Soft gamma-repeaters (SGRs) are characterised by irregular short bursts of soft γ-rays and X-rays, often repeating on timescales of hours to days, followed by longer periods of inactivity. Along with anomalous X-ray pulsars (AXPs), they are conjectured to be manifestations of magnetars (for reviews, see e.g. Mereghetti 2008, 2013; Kaspi & Beloborodov 2017; Esposito et al. 2021). Magnetars are posited to be young (with typical magnetic dipole spin-down ages of 103 − 105 yr), isolated, slowly rotating neutron stars (NSs; periods of typically 2–12 s) with period derivatives in the range 10−13–10−9 s s−1 and inferred magnetic field strengths between 1014 and 1015 G (Kouveliotou et al. 1998, 1999; Olausen & Kaspi 2014). There are now ∼30 confirmed or candidate magnetars within the Milky Way and Magellanic Clouds (Olausen & Kaspi 2014)1. However, progress in understanding magnetars has been slow due to the difficulty of observing them in other wavebands and a dearth of clear evidence of their progenitors and birth places. This is in part a consequence of their scarcity and locations behind large column densities in the Galactic plane, where most magnetars have been discovered. It also creates uncertainties in their distances (e.g. Durant & van Kerkwijk 2006a; Bibby et al. 2008; Zhou et al. 2020; Bailes et al. 2021) and, hence, birth rates (Beniamini et al. 2019), energetics, and kinematics (e.g. Lyman et al. 2022).
The known population of magnetars is clearly dwarfed by the young radio pulsar population (Manchester et al. 2005). It may be that magnetars are not an uncommon outcome of core-collapse, but that their magnetic field rapidly decays, making them observationally rare (Beniamini et al. 2019). Alternatively, they may be intrinsically rare at birth. Perhaps they come only from more massive progenitors (e.g. Gaensler et al. 2005), preferentially arise from progenitors that have undergone a stellar merger (e.g. Schneider et al. 2020; Sherman et al. 2024), or have a different, rare progenitor channel (e.g. accretion or merger-induced collapse; Nomoto & Kondo 1991; Fryer et al. 1999; Levan et al. 2006; Tauris et al. 2013; Ruiter et al. 2019; Cheong et al. 2025). Distinguishing these origins based on population statistics alone is challenging due to strong observational biases (e.g. magnetars are typically discovered in outburst).
In principle, studies of magnetar environments and their multi-wavelength spectra can play a major role in determining their nature. By identifying their natal environments, it is possible to independently estimate their age (and progenitor mass) from that of their putative parent stellar population or associated supernova remnant (SNR; Figer et al. 2005; Muno et al. 2006; Bibby et al. 2008; Davies et al. 2009; Narita et al. 2023), which, in turn, has major implications for the estimate of their birth rates.
Furthermore, studying the multi-wavelength emission itself can provide valuable insight into the mechanisms of energy production from the SGR, enabling one to discriminate between magnetospheric emission (Beloborodov & Thompson 2007; Zane et al. 2011) and alternatives, including emission from a supernova fallback disc around the magnetar (e.g. Perna et al. 2000; Marsden et al. 2001; Wang et al. 2006; Kaplan et al. 2009a; Muñoz-Darias et al. 2016; Tong et al. 2016; Xu & Li 2019; Hare et al. 2024). We note the long-period compact central object 1E 161348-5055 in SNR RCW 103 (De Luca et al. 2006), which may be a magnetar whose rotation period has been slowed to ∼6.7 hours via interaction with a fallback disc (Rea et al. 2016). A further possibility is a binary companion origin for the optical/near-infrared (NIR) emission (Pizzolato et al. 2008; Popov 2016; Chrimes et al. 2022b,a).
Magnetars have been well studied at high energies as they are usually strong persistent X-ray emitters, with X-ray luminosities of about 1034 − 1036 erg s−1, thought to be powered by the ultra-strong magnetic field of these NSs (Duncan & Thompson 1992; Thompson & Duncan 1993). They are often detected at hard X-ray and soft gamma-ray energies (not only through SGR behaviour but also via their short to intermediate bursts and giant flares, both Galactic and extragalactic; Mazets et al. 1979, 1999; Palmer et al. 2005; Götz et al. 2006; Burns et al. 2021; Mereghetti et al. 2024), and sometimes also at radio frequencies (e.g. Camilo et al. 2006, 2007; Helfand et al. 2007; Deller et al. 2012; Shannon & Johnston 2013).
Despite the observational challenges presented by their dusty, often crowded sight lines, searches for optical/NIR counterparts have been partially successful, with a growing sample of candidates being found (e.g. Chrimes et al. 2022b). These magnetar counterparts are faint, with magnitudes (K) of ∼20–24 (Hulleman et al. 2001; Israel et al. 2002; Rea et al. 2004; Israel et al. 2005; Kosugi et al. 2005; Durant & van Kerkwijk 2006c; Testa et al. 2008; Levan et al. 2018; Testa et al. 2018; Chrimes et al. 2022b). They can be differentiated from confused stellar sources thanks to their unusual colours (Durant & van Kerkwijk 2006c; Testa et al. 2008; Chrimes et al. 2022a), short-timescale optical variability (at the rotation period; Dhillon et al. 2005, 2009, 2011), and variability on timescales of months to years (Israel et al. 2002; Rea et al. 2004; Kosugi et al. 2005; Durant & van Kerkwijk 2006b; Lyman et al. 2022; Chrimes et al. 2022b).
Improvements in adaptive optics technology, and the application of the Hubble Space Telescope (HST) to the problem, have improved the certainty of these identifications by greatly enhancing the spatial resolution of the observations and removing confusion. In turn, these IR detections have enabled proper motions to be determined for five magnetars (Tendulkar et al. 2012, 2013; Lyman et al. 2022), with velocities of vt ∼ 100 − 300 km s−1 (with four of the five determined proper motions at the lower end of this range). In four out of the five cases, these proper motion vectors point back either towards clusters of massive stars (in the case of SGR 1806-20 and SGR 1900+14) or towards a recent SNR (in the case of AXP 1E 2259+586 and SGR 1935+2154). Only in one case (4U 0142+61; Tendulkar et al. 2013) does the proper motion not allow the identification of a likely birth site. A small number of magnetars have a proper motion determined from very long baseline interferometry (VLBI) radio observations (Helfand et al. 2007; Deller et al. 2012; Ding et al. 2024), but even the highest-resolution X-ray observatories, such as Chandra, struggle to measure such small proper motions (e.g. Motch et al. 2007). Even when proper motions can be measured, the high column densities and extinctions typical of magnetar sight lines make associations with SNRs or star-forming regions difficult. Nevertheless, these multi-wavelength observations, along with the Galactic distribution of magnetar candidates (tightly aligned with the plane; Olausen & Kaspi 2014), offer strong support for a model in which magnetars are young NSs born in a population of young, and potentially very massive, stars. It has been suggested that magnetars could experience large kicks at their formation, caused by the strong magnetic fields present in the progenitor (Duncan & Thompson 1992; Sawai et al. 2008). In this case, we might expect to see rapid proper motion from SGRs and other magnetars, but on the contrary, the growing sample of magnetar velocities are similar to those of young pulsars (Lyman et al. 2022; Ding et al. 2024).
Galactic SNRs associated with magnetars do not show evidence of additional energy injection (e.g. Vink & Kuiper 2006; Martin et al. 2014), and population synthesis studies disfavour a scenario in which Galactic magnetars produced gamma-ray bursts at the moment of their formation (Rea et al. 2015). This disfavours very short initial rotation periods for Galactic magnetars. One possible explanation for the origin of the strong magnetic fields is a dynamo mechanism (e.g. Spruit et al. 2008; White et al. 2022; Barrère et al. 2022, 2025; Reboul-Salze et al. 2024). Alternatively, the magnetic field may be inherited from the progenitor (the fossil field scenario, if the progenitor magnetic flux is conserved during collapse; Ferrario & Wickramasinghe 2006; Shenar et al. 2023).
SGR 0501+4516 was discovered on 22 August 2008 by the Neil Gehrels Swift Observatory (hereafter Swift) Burst Alert Telescope (BAT), through the detection of SGR-like bursts (Barthelmy et al. 2008a,b; Rea et al. 2009). SGR 0501+4516 was subsequently observed to exhibit X-ray (Gogus et al. 2008) and optical pulsations at the rotational period of 5.76 s (Dhillon et al. 2011). It has a measured period derivative of ∼1.5 × 10⁻¹¹ s s−1, an inferred magnetic field strength of ∼2 × 10¹⁴ G, and a characteristic age of ∼15 kyr (Camero et al. 2014). The activation of this SGR in 2008 followed a very long period of quiescence (Rea et al. 2009). In the days following the onset of activity, dozens of bursts were observed, with fluxes exceeding the underlying continuum by a factor of > 105. The bursts reached maximum luminosities of ∼1041 erg s−1 and had durations of < 1 s, typical of short bursts emitted by magnetars (e.g. Mereghetti 2008).
In this paper we report observations of the NIR counterpart to SGR 0501+4516 in the months following its initial 2008 outburst, and the results of a subsequent ∼12 year campaign of NIR monitoring, which include a HST-derived proper motion. The location in the Galactic anti-centre direction, the consequent lack of crowding, and the relatively low extinction make SGR 0501+4516 an ideal case for investigating the optical/NIR properties and birth site of a magnetar. All magnitudes are reported in the Vega system and all times are UT.
2. Observations and analysis
After the first detection of high energy bursts from SGR 0501+4516 by Swift/BAT, NIR data were obtained promptly with the 3.8 m United Kingdom InfraRed Telescope’s (UKIRT) Fast-Track Imager (UFTI) at the Mauna Kea Observatory, using its rapid-response mode. Subsequent NIR data were obtained over the following 4 years using the 8.1 m Gemini-North’s Near-InfraRed Imager and spectrometer (NIRI) at Mauna Kea, and the Long-slit Intermediate Resolution Infrared Spectrograph (LIRIS) on the 4.2 m William Herschel Telescope at the Roque de Los Muchachos Observatory. Finally, we obtained three epochs of observations with HST/WFC3 in October 2010, October 2012, and August 2020, as listed in Table 1.
Differential photometry of SGR 0501+4516 relative to 2MASS stars within the field of view of NIRI, UFTI, and LIRIS, plus HST NIR magnitudes for SGR 0501+4516 in 2010, 2012, and 2020 (given in the last four rows).
Ground-based data were reduced using the respective instrument pipelines. Photometric calibration was performed using the two micron all-sky survey (2MASS; Skrutskie et al. 2006), which has also been used for astrometric calibration. The UFTI and NIRI K-band filters are K, while the LIRIS and 2MASS K-band filters are Ks. For UFTI and NIRI photometric calibration, a small correction of 0.02 magnitudes has first been applied to bring all 2MASS Ks-band magnitudes to K, using Ks = K + 0.002 + 0.026(J − K). The mean J-K value for 2MASS field stars within 1 arcmin is 1.0 ± 0.22. The precision of this photometric calibration is limited by uncertainties in the flat fielding corrections, the lack of good NIR flux standards, and the scatter in the Ks to K conversion.
We obtained three epochs of observation of SGR 0501+4516 with HST/WFC3. The first two were obtained on 19 October 2010 and 8 October 2012, approximately 720 days apart. For these epochs we obtained a single orbit of observation in the F160W (broad H band, effective wavelength 15 278 Å) filter. Each observation consisted of four dithered exposures in a standard box pattern, and the orientation was chosen such that diffraction spikes from nearby bright stars did not impinge on the source position. The third epoch was obtained on 4 August 2020, and consisted of F125W (broad J band, effective wavelength 12 364 Å) and F160W observations, each with three dithers (for further details, including exposure times, see Table 1 and Chrimes et al. 2022b).
The images were retrieved from the archive3 and reduced with standard astrodrizzle (Fruchter & Hook 2002) procedures with DRIZZLEPAC4 using a pixel scale of 0.065″ per pixel and pixfrac = 0.8. Since we are interested in astrometric fidelity, we used the most up to date distortion tables and determined shifts between each dithered image directly from sources in the image (using tweak shifts) rather than from the pre-programmed offsets. These images were then drizzled to a common (Gaia DR3) reference frame and orientation, where the alignment is via cross-correlation of stars with the same 25 Gaia Data Release 3 (DR3) sources at the epoch of each image.
A single source coincident with the position of the X-ray counterpart to SGR 0501+4516 (Woods et al. 2008; Camero et al. 2014; Göǧüş et al. 2010) is visible in all co-added observations. The position of this source, referenced to 2MASS, is  ,
,  , with an error of 0.2 arcsecond in both coordinates. This is 0.10 arcseconds from the centroid of the Chandra localisation (Göǧüş et al. 2010). We therefore identify this source as the NIR counterpart to SGR 0501+4516; subsequent variability clinches this association. For the NIRI data, the source is also detected in the individual 60 second exposure frames, although at a very low significance level in the J and H bands.
Photometry of the ground-based IR imaging was performed using IRAF (Tody et al. 1986) aperture photometry routines. We calibrated to a sequence of nearby 2MASS stars, ensuring the accuracy of the relative photometry, our HST observations were photometrically calibrated using the published HST zero points for WFC3/IR. The results for the SGR counterpart are provided in Table 1.
We additionally searched for short timescale variability, on the timescales permitted by the individual frames (NIRI; individual frames with exposure times of 30–60 seconds) or sub-coadded frames (UFTI; integration times of 5 minutes). We find no evidence of such variability: the source remains essentially constant over periods of 15–30 minutes. However, much higher cadence observations (< 1 second) in both the optical and IR have revealed coherent pulsations with a period of 5.7 seconds, identical to the X-ray derived period (Dhillon et al. 2011), thus confirming the counterpart identification.
3. Properties of the NIR counterpart of SGR0501+4516
3.1. The IR light curve
The IR light curve of SGR 0501+4516 is shown in Fig. 2, in addition to the X-ray light curve from Rea et al. (2009) for comparison. The X-ray light curve is extrapolated to a specific flux at 1 keV based on the power-law plus black body model obtained for the outburst phase by Rea et al. (2009). T0 is defined as August 22.53 2008 (MJD 54700.53), which is the time of the Swift/BAT trigger. The IR light curve shows a prolonged plateau, with a slow fading, followed by a more rapid fading. This can be fit with a smoothly broken power law, where α1 and α2 are the pre and post-break decay slopes defined as Fν ∝ t−α and tb is the break time. We find tb = 6.1 ± 2.6 days, with decay indices of α1 = 0.03 ± 0.03 and α2 = 0.34 ± 0.03. This can be compared to the behaviour of the X-ray flux over the same temporal baseline, which yields tb, x = 8.3 ± 0.3, with slopes of α1 = 0.05 ± 0.05 and α2 = 0.51 ± 0.03, suggesting that the X-ray and IR light curves are broadly tracking each other, although the IR decay is slower than the X-ray post-break. This may suggest evolution in the black-body+power-law spectrum observed in outburst (Rea et al. 2009). At very late times, the IR light curve appears to plateau at around m(F160W) ∼ 22.5 (see Table 1), suggesting that these observations have reached a quiescent level. Since these are F160W (H-band) observations rather than K, we cannot directly subtract the flux. However, assuming a power law in fν determined by F160W-F125W, we can estimate the late-time K-band flux as approximately ∼2.2 μJy. Adopting this as the quiescent K-band contribution at all times pushes the IR decay closer to the X-ray decay rate, with fit parameters tb = 7.4 ± 3.4 days, α1 = 0.04 ± 0.04, and α2 = 0.47 ± 0.07.
3.2. Spectral energy distribution
The spectral energy distribution of SGR 0501+4516 one day after outburst is shown in Fig. 3. The XMM-Newton spectra are those obtained from early and late observations, and have been reduced as described in Rea et al. (2009). The figure shows the NIR fluxes as observed, and as they would appear corrected for a Galactic extinction of AV = 4 with a Fitzpatrick (1999) extinction law and RV = 3.1. However, since SGR 0501+4516 lies within the Galactic disc it is not necessarily appropriate to correct the observed fluxes for the (highest estimate) of the total Galactic column from Schlegel et al. (1998), and the true fluxes will lie between the two values, as demonstrated in Fig. 4.
Another estimate for the line-of-sight reddening is based on the X-ray hydrogen column density, which was found to be (0.89 ± 0.01)×1022 cm−2 (Rea et al. 2009). We can convert this to an extinction using AV-NH relations. For instance the relation of Predehl & Schmitt (1995) yields AV ∼ 4.9 for SGR 0501+4516 while Schady et al. (2008) gives AV ∼ 4.7. These values compare with total extinction values of ∼3.4 and ∼4 from the Schlafly & Finkbeiner (2011) and Schlegel et al. (1998) Galactic dust maps, respectively. The Bayestar 2019 3D dust map (Green et al. 2019) yields AV ∼ 2.7 at ∼2 kpc, the approximate distance of the Perseus arm on this line of sight. The high AV inferred from the X-ray may suggest a relatively large distance for the SGR (i.e. looking through much of the dust and gas in the direction), but the inferred extinctions are in excess of even the total sight-line extinction, so the high AV could instead indicate a high-NH column local to the X-ray emitting region.
The counterpart has markedly non-stellar colours (Fig. 1 and Table 1), and lies well away from the stellar locus (in common with most other magnetar NIR counterparts; see e.g. Chrimes et al. 2022a). Between the two Gemini/NIRI epochs on 23 August 2008 and 1 September 2008, the counterpart (in addition to fading) showed evidence of becoming bluer in the IR bands, specifically evolving from J − K = 2.24 ± 0.05 to J − K = 1.99 ± 0.08.
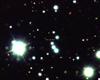 |
Fig. 1. NIR image (JHK bands) of the field of SGR 0501+4516 as imaged with Gemini/NIRI (see Table 1). SGR 0501+4516 is marked with crosshairs and is notably redder than the surrounding field stars. The image has dimensions 45 × 36 arcsec and is oriented north up, east left. |
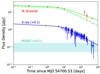 |
Fig. 2. NIR and X-ray light curve of SGR 0501+4516 up to ∼500 days post-discovery in 2008. The red points correspond to the NIR and the blue to the X-ray data from Rea et al. (2009), supplemented with later Swift observations (Coti Zelati et al. 2018). The cyan shaded box represents the ROSAT quiescent level and its associated error (also from Rea et al. 2009). All X-ray fluxes are reduced by a factor of 10 for clarity. The dashed green and solid blue lines are broken power-law fits to the NIR and X-ray data, respectively (see Sect. 3.1). Due to the difficulty of fully accounting for colour terms between the Ks and K bands, we have plotted only the K-band observations (red points and solid green line). In faded red and with a dashed green line is the K-band light curve fit after the subtraction of an approximate quiescent flux level, as described in the text. The X-ray light curve is plotted as a specific flux (Fν) at 1 keV based on the spectral model and count rate obtained from XMM-Newton observations in the 0.3–10 keV range; it assumes no X-ray spectral variability, although such effects would have only a small impact on the observed flux in any case. |
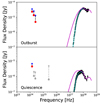 |
Fig. 3. Top: Spectral energy distribution of SGR 0501+4516 from the X-ray to the NIR as measured one day after the first outburst. The X-ray spectra were obtained by XMM-Newton. We show NIR observations without extinction correction (lower, red points) and with extinction correction (upper, blue points) assuming a total Galactic E(B − V) = 1.3 in that direction. The true extinction will lie between these extremes (see Fig. 4). Bottom: K-band and X-ray spectral energy distribution at ∼200 days. In grey are the late-time i-band flux level (Dhillon et al. 2011) and the F125W and F160W HST fluxes from the 2020 epoch. In both panels, the X-ray data are fitted with the models from Rea et al. (2009, cyan lines). Unabsorbed (and extrapolated) versions of these models are shown with magenta lines. |
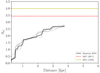 |
Fig. 4. Visual extinction, AV, as a function of distance along the sight line to SGR 0501+4516. The solid black line is the best-fit Green et al. (2019) Bayestar 3D dust map extinction along the sight line. Dashed grey lines are random draws from the Bayestar probability distribution. Also shown are the total sight-line extinctions from Schlegel et al. (1998) and Schlafly & Finkbeiner (2011). The Bayestar flattening at ∼3.5–4 kpc corresponds to the point at which main sequence stars can no longer be detected (and the extinction estimate becomes unreliable). The distance to SGR 0501+4516 is unknown, but we assumed it lies at ∼2 kpc, in the Perseus spiral arm. |
4. Proper motion measurement
Measuring proper motions for magnetars can constrain their space velocities and possible birth sites, both of importance for understanding their origins. Well-spaced X-ray observations with Chandra (e.g. SGR 1900+14 and AXP 1E 2259+586; de Luca et al. 2009; Kaplan et al. 2009b) have only yielded upper limits for magnetars, although X-ray proper motions are possible in principle if the motion is substantial enough (e.g. Rigoselli et al. 2024). There are only a few measurements arising from very long-baseline radio interferometry (AXP XTE J1810-197, 1E 1547.0-5408, and Swift J1818.0-1607; Helfand et al. 2007; Deller et al. 2012; Ding et al. 2024). Ground-based NIR adaptive optics imaging of SGRs 1806−20 and 1900+14 have provided direct measurements of their proper motions, strengthening suggestions of their origin in young stellar clusters (Tendulkar et al. 2012). Similar velocity constraints have also been placed on AXP 1E2259+586 and AXP 4U0142+61 (Tendulkar et al. 2013). In the case of AXP 1E2259+586, the proper motion makes a compelling case for an origin in the SNR CTB 109, although in the example of AXP 4U0142+61 it has not been possible to find an association with either a young star cluster or a SNR. Since then, the identification of the NIR counterpart of SGR 1935+2154 with HST (Levan et al. 2018) and subsequent epochs of observations have enabled a NIR proper motion measurement for this object too (Lyman et al. 2022). Tracing back the proper motion over the characteristic lifetime of SGR 1935+2154 places it at the centre of SNR G57.2+08.
SGR 0501+4516 offers a new opportunity to obtain a magnetar proper motion measurement. To determine its proper motion, we used the method of Lyman et al. (2022) and the three epochs of observations with HST, spread across a temporal baseline of ten years (2010–2020; see Table 1). The source is well detected in all three epochs with broadly consistent magnitudes of m(F160W) = 22.45 ± 0.02, 22.48 ± 0.02 and 22.56 ± 0.07 (Vega system, statistical uncertainties only). This corresponds to signal-to-noise ratios (SNRs) of 78, 68 and 26. The first two observations have longer exposure times and yield higher SNRs, allowing the centroid of the source (measured with DOLPHOT; Dolphin 2000) in a single image to be determined to better than 0.05 pixels (the full width at half maximum divided by 2.3 times the S/N) or < 1 mas (statistical uncertainty only, per axis).
For a proper motion measurement we must define an astrometric reference frame. It is standard to do this in a relative sense, with the use of common tie points in each image, and indeed the moderate Galactic latitude of SGR 0501+4516 does allow for a sufficient number of stars to be used as such. However, utilising this approach with HST will produce an alignment that is limited by the genuine proper motions of the stars and other effects beside the limitations of the data quality (which is dictated primarily by instrument stability and capability to accurately centroid sources). Instead, we followed the method presented in Lyman et al. (2022), itself built upon that from Bedin & Fontanive (2018). Succinctly, each image was aligned to the Gaia absolute astrometric frame (Gaia Collaboration 2021) using the positions and proper motions of stars to determine an epoch-corrected equatorial solution. After fitting for this alignment solution (for details, we refer the reader to Lyman et al. 2022), the positions of stars could be freely converted between coordinate systems, including onto each HST image’s (X, Y) pixel coordinate plane.
Two residual effects in the position of stars remain at this point owing to solar motion and Galactic rotation. A simple model of the Galaxy’s rotation, including the Sun’s position and peculiar motion is used to remove this effect (see Lyman et al. 2022). Finally, stars are robustly cross-matched between epochs,
with the RMS residual on these cross-matches giving our alignment uncertainty. The Gaia-HST offset uncertainties (68th percentiles) are 9.2, 3.7, 5.7, and 3.1 mas for the four epochs in chronological order. The total uncertainty on the source position in a given epoch is therefore given by the quadrature sum of the centroid and astrometric alignment uncertainties. The shifting coordinates of SGR 0501+4516 within the absolute frame set by Gaia then provides our proper motion constraints. The results of this analysis are shown in Fig. 5.
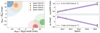 |
Fig. 5. Left: Offsets of SGR 0501+4516 in 2D-projected equatorial coordinates in each of the three HST epochs (note that epoch 2020.6 has observations in two filters) with respect to the mean position across all four sets of observations. Dark and light shaded ellipses correspond to the 1 and 3 σ uncertainties, respectively. Right: Linear fits to positional offsets of SGR 0501+4516 in α⋆ and δ, including corrections for solar and Galactic motion, as a function of time. The uncertainties on the points show the overall positional uncertainties on SGR 0501+4516 at each epoch, including residuals from the astrometric tie to the Gaia Early Data Release 3 reference frame. The two 2020 points are from the two filters, and the rightmost marker in the right-hand panels has been arbitrarily shifted by 0.15 years for visual clarity. The best-fit proper motions in each coordinate are indicated, and a shaded region indicates the 1σ uncertainty on the fit. |
Our results show that, after correction for Galactic and solar motion, SGR 0501+4516 has a transverse peculiar motion (i.e. with respect to its local standard of rest) of μαcos(δ) = 4.14 ± 0.65 and μδ = −3.48 ± 0.44 mas yr−1. At a distance of 2 kpc, this equates to a tangential velocity of 51 ± 14 km s−1, although the somewhat unconstrained distance to the source also adds a significant source of additional uncertainty. We show this in Fig. 6 for a reasonable distance bounds, and how the inferred velocity compares with the broader populations of magnetars and pulsars. SGR 0501+4516’s tangential velocity of 51 ± 14 km s−1 is a low value for pulsars and similar to the transverse velocity of magnetar Swift J1818.0-1607 (Ding et al. 2024), which is convincingly associated with a radio-detected SNR based on a common distance and Swift J1818.0-1607’s past trajectory (Ibrahim et al. 2023; Ding et al. 2024). The peculiar transverse velocity of SGR 0501+4516 places it among the slowest ∼10% of pulsars (e.g. Hobbs et al. 2005), although we cannot rule out a larger radial component.
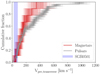 |
Fig. 6. Cumulative distribution of the nine magnetar peculiar transverse velocities, including SGR 0501+4516, measured so far. These measurements are for XTE J1810-197 (VLBI; Helfand et al. 2007), 1E 1547.0-5408 (VLBI; Deller et al. 2012), SGRs 1806-20 and 1900+15 (NIR; Tendulkar et al. 2012), AXPs 1E 2259+586 and 4U0142+61 (NIR; Tendulkar et al. 2013), SGR 1935+2154 (NIR; Lyman et al. 2022), Swift J1818.0-1607 (Ding et al. 2024, VLBI), and SGR 0501+4516 (this work). Multiple draws from each magnetar’s velocity probability distribution are made, assuming Gaussian uncertainties on the velocities. The same process is applied to the pulsar distribution in grey (data from Verbunt et al. 2017). SGR 0501+4516, whose velocity range for distances between 1 and 3 kpc is indicated by the shaded band, is the joint-slowest magnetar yet discovered, at least in projection, and is among the slowest ∼10% of pulsars with similar measurements. |
5. The birthplace of SGR0501+4516
In Fig. 7 we show the extrapolated vector of the SGR proper motion, and its plausible birth sites for ages of 10 kyr, 50 kyr and 1 Myr. In each case we examined broadband optical/IR imaging (from our HST imaging, DSS, and the WFCAM Galactic Plane Survey; Lucas et al. 2008), Hα imaging from the INT/WFC Photometric Hα Survey of the Northern Galactic Plane (IPHAS; Drew et al. 2005; Greimel et al. 2021) and 1.4 GHz (Canadian Galactic Plane Survey; Taylor et al. 2003) radio observations (unfortunately SGR 0501 lies outside the MeerKAT Galactic plane survey footprint; Anderson et al. 2025). It is important to note that age estimates for SGR 0501+4516 (∼10–20 kyr; Camero et al. 2014) are already at the lower end of the 104–106 yr range shown in Fig. 7. This means that the region containing the likely birth site is commensurately smaller.
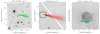 |
Fig. 7. Possible range of past trajectories of SGR 0501+4516 based on the proper motion as measured with HST. Left: HST/WFC3 F160W image of the field surrounding SGR 0501+4516. The possible past trajectories of SGR 0501+4516 are indicated by the light green transparent lines. These are random draws from the RA and Dec proper motion distribution, defined by their best-fit values and uncertainties (assuming these are Gaussian), multiplied by an age of τ ∼ 10 kyr. Middle: Same but for a wider field of view and IPHAS Hα imaging. The past trajectory over 105 years is shown in red, and the trajectory of 104 years (same as in the left panel) is shown in green. A dashed circle with radius 15 kyr × 5.4 mas yr−1 is also shown. Right: Wide-field 1.4 GHz image from the Canadian Galactic Plane Survey. The trajectory over 1Myr is shown in light blue (105 again in red), demonstrating that SGR 0501+4516 and SNR HB9 are not physically associated. In each case, the field of view of the previous panel is shown. As discussed in the text, there is no evidence of any region of intense star formation within this area that might have given rise to the progenitor star of SGR 0501+4516. The dark points on the radio image are compact sources, the vast majority of which are believed to be extragalactic (Leahy & Roger 1996). |
5.1. Association with supernova remnant HB9
The position of SGR 0501+4516 is close to the Galactic SNR HB9, whose centre lies roughly 80′ from the SGR. Gaensler & Chatterjee (2008) suggested that the two could both be remnants of the same progenitor. It is then reasonable to ask what is the probability of finding SGR 0501+4516 so close (in projection) to a known SNR by chance. Taking the Galactic SNR catalogue of Green (2019), we selected all SNRs within ±5 deg of the Galactic plane and ±45 deg of the Galactic anti-centre in longitude. There are 13 SNRs in this portion of the sky, or ∼0.01 SNRs deg−2. Taking the offset of SGR 0501+4516 to HB9, we can use a probability of chance alignment argument, where Pchance = 1 − eΣπr2, Σ = SNRs deg−2 and r is the offset in degrees (Bloom et al. 2002). In this case, Pchance ∼ 0.05, so the simple proximity of SGR 0501+4516 and HB9 on the sky does not offer strong support for their association.
HB9 lies at an estimated distance of ∼1 kpc, and a suggested age of tSNR = 4000 − 7000 years (Leahy & Tian 2007). This age is somewhat younger than the characteristic age of SGR 0501+4516. While uncertainties in both ages might suggest that such an association should be considered, our measured proper motion vector rules out an association with HB9 at high significance. It lies in the wrong direction, and even if it did not, with a projected velocity of ∼50 km s−1, the magnetar could only reach such a large projected angular offset in a lifetime of ∼106 years. This is much longer than the plausible age of the SNR and of the estimated age of SGR 0501+4516. For SGR 0501+4516 to reach an 80 arcmin offset within the age of the SNR, it would need a kick velocity of several thousands of km s−1.
A physical association between SGR 0501+4516 and HB9 is therefore ruled out by both the magnitude and direction of the proper motion. It is interesting to note that HB9 appears to contain a different NS (pulsar PSR B0458+46). This might point to a core-collapse origin for that SNR, and hence recent star-formation nearby SGR 0501+4516.
However, there are two arguments for pulsar PSR B0458+46 also being physically unassociated with HB9. First, its inferred age is much greater than that of the HB9 SNR (Leahy & Tian 2007); second, distance estimates for HB9 place it at ∼1 kpc (in or in front of the Perseus arm), while the latest distance estimates for PSR B0458+46 place it well behind the Perseus arm (> 2.7 kpc; Jing et al. 2023). Therefore, HB9 and PSR B0458+46 may only be co-located in projection. In the absence of any other candidate NS in HB9 and the lack of potential massive star birth sites nearby (see the remainder of this section), it is possible that HB9 is a supernova Ia remnant, and the tension between SGR 0501+4516 as a product of massive star core-collapse and its environment remains.
5.2. Stellar clusters and stars with overlapping past trajectories
The positional uncertainty of SGR 0501+4516 at any time t in the past is roughly an ellipse, whose ellipticity and orientation is set by the uncertainties on the position and proper motion, and whose size increases linearly with time. In the left-hand panel of Fig. 7, there are numerous stars in the field of view, but relatively few along the possible past trajectory of SGR 0501+4516, and none of these appear to reside in obvious bright clusters. Given the excellent point spread function of our HST observations (∼0.1″) it is unlikely that these stars are masking a compact stellar cluster, which we would expect to observe.
At a distance of 1.5–4 kpc and extinctions up to AV ∼ 3, O or B stars would have NIR apparent magnitudes of ≲16 (Chrimes et al. 2022a), so our HST observations should therefore be able to detect any young star-forming regions or clusters, but none appear to be present. The characteristic age and proper motion of SGR 0501+4516 mean that a host cluster should be visible and in close proximity (if present). Indeed, there are no O-stars (with Teff ≳ 30 000 K) within a few degrees of SGR 0501+4516 in the StarHorse Gaia catalogue of Anders et al. (2019). Young clusters have been suggested as the birthplaces of SGR 0526-66, SGR 1900+14, SGR 1806-20, and CXOU J1647-45 (Klose et al. 2004; Vrba et al. 2000; Bibby et al. 2008; Clark et al. 2014), but, if the age estimate is broadly correct (it is likely to be an upper limit; see Sect. 6.1), we can confidently rule out such a scenario for SGR 0501+4516.
In the case of CXOU J1647-45, located in the cluster Westerlund 1, there is also a runaway star (space velocity > 30 km s−1; Blaauw 1961) that has been linked with the magnetar progenitor system. Runaway stars can be produced either dynamically (i.e. they are ejected from a cluster through dynamical interactions; Poveda et al. 1967; Gies & Bolton 1986) or through ejection by the supernova of a binary companion (e.g. Eldridge et al. 2011; Sana et al. 2014; Renzo et al. 2019; Chrimes et al. 2023). We therefore searched for stars in Gaia whose past trajectories intersect the past trajectory of SGR 0501+4516 within the last 20 kyr (age estimates for SGR 0501+4516 are in the range 10–20 kyr; Camero et al. 2014). For this, we made use of Gaia DR3 (Gaia Collaboration 2023), evolving the positional uncertainty ellipses of stars within 0.5 deg of SGR 0501+4516 back in 100 equal time-steps over 20 kyr. We only considered sources with a proper motion and parallax measurement, and whose distance lies in the range 1 < d/kpc < 3.
We determined if SGR 0501+4516 is spatially consistent with each Gaia star at each time-step by calculating the value of a 2D, elliptical Gaussian distribution, corresponding to the probability of finding the object at that position, at each position across the 0.5 deg × 0.5 deg area considered. The ellipsoidal region of positional uncertainty is rotated with respect to the projected RA α⋆ and Dec δ axes (where α⋆ = α × cos(δ)) according to the GaiaPMRA_PMDEC_CORR parameter, where the rotation is defined as θc = cos−1(PMRA_PMDEC_CORR). The probability density function for a source with best-fit coordinates ( ) and uncertainties (σα⋆, σδ) at projected equatorial coordinates (α⋆, δ) is then given by
 (1)
(1)
where
 (2)
(2)
The product of each star’s and SGR 0501+4516 ’s probability density function is calculated, and then integrated across the whole area, such that the total probability P of SGR 0501+4516 and any given Gaia star being spatially coincident at each time-step is given by
 (3)
(3)
In Fig. 8 we show the two Gaia sources whose separations from SGR 0501+4516 at some point in the last 20 kyr yield a probability of being spatially coincident of 10−5 or greater. The probability of these objects being associated with SGR 0501+4516 never exceeds ∼10−3. The peculiar transverse velocities (calculated with Gaia distances from the parallax and proper motions) and G-band magnitudes are shown in the right-hand panel of Fig. 8, overlaid on Binary Population and Spectral Synthesis (BPASS; Eldridge et al. 2017; Stanway & Eldridge 2018) predictions for unbound companions to the first supernova in a binary (Chrimes et al. 2023). The absolute magnitudes are corrected for the line-of-sight extinction, at the inferred distance of each object, using the Bayestar 3D dust map (Green et al. 2019), the effective wavelength of the GaiaG filter, assuming RV = 3.1, and a Fitzpatrick extinction law (Fitzpatrick 1999). We again emphasise that on this sight line, the maximum distance and extinction (∼4 kpc with AV ∼ 3) mean that effectively all OB stars should be brighter than Gaia’s G ∼ 21 limiting magnitude.
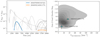 |
Fig. 8. Left: Product of overlapping elliptical 2D Gaussians, representing the positional uncertainty of SGR 0501+4516 and Gaia sources in the vicinity, as a function of time. Only sources with 1D radial separations with more than 3σ significance are shown. We find two Gaia objects that meet this criterion (orange and blue). The grey lines are Gaia matches found when the SGR proper motion vector is rotated by 90, 180, and 270 degrees. The ‘real’ matches are not obviously distinct from the false or random matches. Right: Two ‘real’ matches, with their extinction-corrected absolute magnitudes (based on their best parallax distances and extinction at that distance in the Bayestar 2019 dust map) plotted against their peculiar transverse velocity. Their Gaia DR3 IDs are labelled. Binary population synthesis predictions for the properties of stars ejected by the supernova of a binary companion are shown with the grey shading (Chrimes et al. 2023), where each contour moving from dark to light grey bounds 10% more of the probability. |
Although the two objects in the right-hand panel of Fig. 8 have distances and past trajectories consistent with SGR 0501+4516, the lack of an obvious SNR or stellar cluster associated with SGR 0501+4516 puts their nature as potential runaways associated with SGR 0501+4516 into doubt. To further verify this, we rotated the proper motion vector of SGR 0501+4516 by 90, 180, and 270 deg and repeated the analysis. Objects whose past trajectories intersect SGR 0501+4516 under these conditions are shown in the left-hand panel of Fig. 8 by grey lines. The ‘real’ matches, shown in colour, do not stand out from the population of random past associations. This is consistent with the low association probabilities we calculated for the two objects of ≲10−3. Hence, we cannot confidently identify any likely runaway candidate associated with SGR 0501+4516 nor any clear SNR or cluster of origin. This is a stronger statement that can be made for objects closer to the Galactic centre, where even bright stars and star formation can be missed due to high extinction, and numerous smaller star-forming regions are likely present.
5.3. Association with other supernova remnants and star-forming regions
We next considered the possibility that we have missed other SNRs or star-forming regions that are plausibly associated with SGR 0501+4516.
In addition to HB9, another SNR, G160.1-1.1, is worth consideration. Only a small arc is visible (see Fig. 10 of Gerbrandt et al. 2014), but if extrapolated into a circle, the radius would be large enough to reach SGR 0501+4516. The faint nebulosity at (160°, 1°) in the right-hand panel of Fig. 7 might plausibly be associated with G160.1-1.1. However, the proper motion of SGR 0501+4516 does not trace back to the centre of this SNR either, and SGR 0501+4516 would have to be far older (and the SNR far older, given the slow proper motion of SGR 0501+4516) than estimated for this scenario to work. We therefore deem it unlikely that G160.1-1.1 is associated with SGR 0501+4516.
The wider field around SGR 0501+4516 is notable for two star-forming complexes, Sh217 and Sh219. They appear to lie at much larger distance that HB9, probably in the outer arm at ∼5 kpc, suggesting that there is some massive star formation at these distances. However, both of these regions have larger projected offsets from the location of SGR 0501+4516 than HB9, and are offset in directions well away from the proper motion vector. We therefore rule these out as the origin of the SGR.
SGR 0501+4516 lies close to the Galactic plane, in the region surveyed by both IPHAS (Drew et al. 2005) and the UKIRT Infrared Deep Sky Survey (UKIDSS) Galactic Plane Survey (GPS; Lucas et al. 2008). This offers the opportunity to survey the environs of SGR 0501+4516 at higher resolution, and to greater depth than is possible via the Digital Sky Survey (DSS) or 2MASS. In addition, the Hα survey is ideal for locating star-forming regions or SNRs that could be the birthplace of a SGR. We show the past trajectory of SGR 0501+4516 overlaid on IPHAS Hα imaging, in Fig. 7. Within a giant molecular cloud the density can be of order 102 − 103 cm−3, compared to typical ISM densities of order 1 cm−3. In such cases, the SNR rapidly sweeps up its own mass and hence is confined within a small volume, as it cannot expand significantly during the free streaming phase. For example, the compact supernovae remnants observed in M82 are thought to be only 0.6–4 pc in radius (Chevalier & Fransson 2001). This corresponds to ∼60–400  ″. Inspection of the available imaging shows no sign of such a cluster or compact SNR within the region constrained by the observed limits on the proper motion combined with the spin-down age.
It is possible, of course, that the progenitor star of SGR 0501+4516 was not in a cluster at the time of its explosion. Under the most popular variants of models for SGR production this seems unlikely, since the progenitor is expected to be a massive star (e.g. the suggested progenitor masses for magnetars are in the range ∼15–50 M⊙; Muno et al. 2006; Bibby et al. 2008; Davies et al. 2009; Borkowski & Reynolds 2017), which is unlikely to travel large transverse distances in its short lifetime (although see e.g. Eldridge et al. 2011). In any case, even if the progenitor exploded outside a cluster, we would expect to easily locate the associated SNR. The ISM density within the Galactic disc is sufficiently high to produce a bright shock, though low enough to enable the SNR to grow to a moderate size in ∼20 kyr, as is the case for HB9.
6. Interpretation
We conclude that with the available data, there is no sign of either a SNR or a young cluster consistent with the birth site of SGR 0501+4516. SGR 0501+4516 is at an unusual Galactic location with respect to most other magnetars, lying in the Galactic anti-centre direction, towards the Perseus arm at ∼2 kpc and the Outer arm at ∼5 kpc. Only SGR 0418+5729, 1E 2259+586, and 4U 0142+61 have a comparable location within the Galaxy (van der Horst et al. 2010). However, 1E 2259+586 has a robust SNR association (Tendulkar et al. 2013), SGR 0418+5729 has a much older characteristic age of 36 Myr (Olausen & Kaspi 2014), and 4U 0142+61 likely lies more distant and behind higher extinction. SGR 0501+4516 therefore remains one of the youngest, likely nearest and least attenuated magnetars in the Galactic population, yet it lacks a clear birth site or associated SNR. This makes SGR 0501+4516 the best known candidate for a magnetar formed in a process other than massive star core-collapse, or might suggest that it had an otherwise unusual progenitor and/or an age that is much older than expected. We examined each of these possibilities in turn.
6.1. Uncertainties on the age of SGR 0501+4516
One possibility is that SGR 0501+4516 is much older than its characteristic age implies. The characteristic age relies on measurements of the period derivative at the current time. To provide an accurate measurement of the age, it requires that spin down has proceeded in a relatively uniform manner, and that the initial period was much smaller than the currently observed one. It is possible that, associated with outburst activity, a magnetar exhibits a period of accelerated spin-down, resulting in a larger value of Ṗ than magnetic braking alone would generate and causing the characteristic age of the NS to be underestimated. If this is the case, the true age of the magnetar may be an order of magnitude larger than the characteristic age. However, even within the region traversable by SGR 0501+4516 in the past several tens of megayears, there are only two SNRs (HB9 and G160.1-1.1), both of which appear inconsistent with the proper motion vector as discussed above, although at ages of 105 years SNRs can become extremely diffuse and essentially invisible to observations, particularly if overlapping in projection with bright structures (such as HB9). Interestingly, Helfand et al. (2007), exploiting the well-determined proper motion of AXP XTEJ1810-197, found no compelling candidate birth sites for an age of less than ∼105 yr (although several SGRs, e.g. SGR 1806-20 and SGR 1900+14, were born in nearby bright clusters, as noted above). In these cases, the high ISM pressure inside the clusters could confine, and effectively mask, the presence of a SNR, explaining the lack of an apparent association. Indeed, if the lifetimes of magnetars can be significantly longer than the canonical 104 years, this would help ameliorate concerns over the rate of magnetar production (given that ∼30 confirmed or candidate magnetars are now known).
By contrast, the AXP 1E 2259+586 lies within the SNR CTB 109, but has a characteristic age approximately 20 times the SNR age, suggesting that sometimes the characteristic age can significantly overestimate the age of the magnetar (e.g. because the magnetic field has decayed with time, and magnetic braking was stronger at earlier times). Although deviations between P/2Ṗ and true ages may plausibly operate in both directions, recent works favour the interpretation that magnetar (and pulsar) characteristic ages are typically overestimates of their true ages (Beniamini et al. 2019; Mondal 2021; Prasanna et al. 2022; Rigoselli et al. 2024).
6.2. SGR0501+4516 as the product of a low-ejecta mass supernova
If the true age of SGR 0501+4516 is instead comparable to its characteristic age, and it did form in a core-collapse event, then a low supernova ejecta mass could explain the lack of a bright SNR (as well as the low peculiar velocity). As discussed in Sect. 5, the ISM density on the sight line to SGR 0501+4516 is broadly conducive to producing moderately large, moderately bright SNRs such as HB9. High ISM densities would confine the SNR (making it bright but small in extent), low ISM densities allow a remnant to rapidly expand, but the surface brightness will be low. If SGR 0501+4516 did form in a supernova at the approximate location implied by the left panel of Fig. 7, the apparent lack of a SNR there may be due to a low ejecta mass (e.g. Tauris et al. 2015), producing a remnant that is smaller, fainter and more rapidly fading than a typical core-collapse SNR. Low ejecta masses can be produced by stripped (or ultra-stripped) stars, which are likely produced through stripping by a binary companion, and may explode as electron capture supernovae (Nomoto 1987). Such a scenario could produce small natal kicks (e.g. Bray & Eldridge 2016). Progenitor masses for magnetars based on the ages of associated stellar clusters and SNR modelling yield a wide range of ∼15–50 M⊙ (Muno et al. 2006; Bibby et al. 2008; Davies et al. 2009; Borkowski & Reynolds 2017). The seemingly low natal kick velocity and lack of other massive stars and clusters in the vicinity of SGR 0501+4516 makes a similar interpretation for this object challenging.
6.3. SGR0501+4516 as the product of a binary neutron star merger
Magnetars can also emerge from the merger of two low-mass NSs in a binary system when the remnant mass post-merger falls below the Tolman-Oppenheimer-Volkoff limit, MTOV, which defines the maximum mass a non-rotating NS can have while remaining stable against gravitational collapse (Oppenheimer & Volkoff 1939). If the mass of the newly formed NS is below this threshold, the remnant can reach hydrostatic equilibrium without requiring additional support from rapid rotation or magnetic fields to counteract gravitational forces.
General relativistic magnetohydrodynamic simulations by various independent groups have demonstrated that, when two NSs merge, the resulting magnetic field can be amplified by several orders of magnitude. This amplification is driven by a combination of magnetic winding due to differential rotation and instabilities such as the Kelvin-Helmholtz instability and magneto-rotational instabilities (Giacomazzo & Perna 2013; Kiuchi et al. 2015; Giacomazzo et al. 2015; Ciolfi et al. 2017; Palenzuela et al. 2022; Aguilera-Miret et al. 2023; Kiuchi et al. 2024). If the merger remnant has a low enough mass to remain stable, it is therefore very likely to acquire a magnetic field in the magnetar range. The remnant may also receive a recoil kick through anisotropic mass loss and gravitational wave emission (Kulkarni et al. 2023).
Magnetars formed through the binary NS merger channel are expected to reside outside of star-forming regions due to the long delay times often associated with binary NS mergers and the kicks imparted by supernovae to each progenitor NS in the binary. These characteristics align with observed properties of short gamma-ray bursts, which are frequently found in low star-formation regions and are known to be associated with binary NS mergers (see e.g. Berger 2014 for a review).
If SGR 0501+4516 is indeed a stable, highly magnetised NS resulting from the merger of two NSs, an interesting question is the expected contribution of such merger products to the overall magnetar population. The fraction of binary NS mergers that produce a stable NS remnant is highly sensitive to both the NS mass function and the equation of state (EoS) of NS matter. Studies by Piro et al. (2017), assuming a Gaussian distribution for the NS mass function based on the observed Galactic NS population, surveyed the remnant populations for several representative EoS models. They found that the fraction of mergers producing stable NSs could range from negligible in an EoS like H4 (Lackey et al. 2006) to a few percent in a stiffer EoS like APR4 (Akmal et al. 1998), and even the majority of cases for very stiff EoS models like SHT (Shen et al. 1998, 2011). Thus, the discovery of a stable magnetar from a binary NS merger could provide constraints on the EoS if this magnetar population can be accurately identified and quantified.
6.4. SGR 0501+4516 as the product of accretion- or merger-induced collapse
A final alternative is that SGR 0501+4516 formed via the accretion- or merger-induced collapse of a magnetic white dwarf (WD; e.g. Nomoto et al. 1979; Nomoto & Kondo 1991; Fryer et al. 1999; Levan et al. 2006; Yoon et al. 2007; Metzger et al. 2008; Tauris et al. 2013; Ruiter et al. 2019; Ablimit 2022; Cheong et al. 2025). This could occur via mass transfer within a binary, or the merger of two WDs, at least one of which is magnetic and with an ONeMg composition. In these scenarios, when the mass of the WD exceeds the Chandrasekhar mass, it undergoes collapse to a NS. In the most simple model, it is assumed that the magnetic flux is conserved during collapse (BR2= constant, where B is the magnetic field strength and R the radius), and hence, for a change in radius of a factor of 500–1000 (typical for a WD and NS) the increase in the magnetic field strength can be a factor of 106. Highly magnetic WDs, with B-fields of 108 − 109 G, could then become magnetars (Levan et al. 2006).
This channel is appealing for SGR 0501+4516 since it is likely that minimal mass is ejected in such a merger (e.g. Fryer et al. 1999). The mean mass of a WD is ∼0.5 − 0.6 M⊙ (e.g. Sidharth et al. 2024), and so the majority of WD-WD systems that exceed the Chandrasekhar mass may well do so only marginally. In this case the majority of the mass is likely to remain in the newly formed NS, leading to low mass ejection and energy, and hence a faint remnant. Thus, in this model the lack of either a SNR or a young cluster can naturally be explained. Furthermore, the low peculiar transverse velocity of SGR 0501+4516 is comparable with the peculiar velocities of WDs (Raddi et al. 2022; Mikkola et al. 2022). This is the qualitative expectation in an accretion or merger-induced collapse scenario, where low ejecta masses (fractions of a solar mass; e.g. Cheong et al. 2025) would likely produce weak natal kicks.
It is reasonable to wonder if the rates of such channels are plausible. Estimates for the core-collapse magnetar formation rate, based on the observed Galactic population size and their characteristic ages, can be as high as > 50% of all core-collapse NSs born as magnetars (Gullón et al. 2015; Beniamini et al. 2019). However, such estimates are heavily influenced by observational biases and are highly uncertain. On the WD-WD side, up to ∼20% of high-mass WDs are thought to be merger products, and the total Galactic rate of WD-WD mergers (of all masses) is estimated at ∼0.1 yr−1 (Cheng et al. 2020). However, to produce a magnetar through this channel, we also required (i) that the final mass exceeds the Chandrasekhar mass, (ii) that the chemical composition is conducive to neutronisation rather than a runaway thermonuclear reaction, thus avoiding a type Ia supernova, and (iii) that the progenitor WD was magnetic. Mergers of WD binaries above the Chandrasekhar mass are expected at the level of 10−3 yr−1 (Nelemans et al. 2001; Levan et al. 2006). Since ≳10% of WDs are magnetic (Hollands et al. 2017), and assuming that these more massive WDs have the ONeMg composition required for neutronisation rather than thermonuclear runaway, the Galactic rate of magnetars from merger-induced collapse is therefore around 10−4 yr−1. Estimates for magnetar formation from the single-degenerate AIC channel are similar, or slightly lower (3 × 10⁻⁵ yr−1; Ablimit 2022). Taking the lower end of the core-collapse magnetar formation rate (∼10−3 yr−1 Beniamini et al. 2019), and the estimated rate of magnetars from merger and accretion-induced collapse (AIC; ∼10−4 yr−1), we could plausibly expect as many as 10% of Galactic magnetars to have a non-core-collapse origin.
Although these rates are uncertain, they suggest that under the assumption that some WD-WD merger leads to collapse to a NS, rather than a type Ia supernova, it is reasonable to expect a non-negligible fraction of SGR and AXPs to originate via this route, and that locating objects such as SGR 0501+4516 would not be unexpected in these circumstances. Currently only two magnetars out of a Galactic population of ∼30 objects – SGR 0501+4516 and potentially 4U 0142 – are known to have young characteristic ages and relatively clear sight lines, and so it is surprising that no birth site has been identified. Out of these, SGR 0501+4516 is the nearest and least attenuated, and thus offers the best constraint.
6.5. Other evidence of delayed magnetar formation channels
An intriguing observation is that a subset of fast radio bursts (FRBs) has been detected in galaxies with no apparent star formation activity, similar to the environment of SGR 0501+4516. FRBs are widely believed to be associated with magnetars, particularly following the observation of FRB-like bursts from Galactic magnetar SGR 1935+2154 (Margalit & Metzger 2018; Margalit et al. 2019; Bochenek et al. 2020; CHIME/FRB Collaboration 2020; Mereghetti et al. 2020; Kirsten et al. 2021). Observationally, around 5% of FRBs have been linked with ancient stellar populations (by residing in massive quiescent galaxies, and in one case a globular cluster; Kremer et al. 2021; Kirsten et al. 2022; Gordon et al. 2023; Sharma et al. 2023; Eftekhari et al. 2025; Shah et al. 2025). A longer radio flash has also been linked with a (possibly magnetar-driven) compact-merger gamma-ray burst (Rowlinson et al. 2024; Sarin et al. 2024). This suggests that at least a fraction of these sources may have formed through delayed channels such as binary NS mergers or WD AIC, rather than recent star formation events. As the sample sizes for both FRBs and SGRs continue to grow, comparative analysis of magnetars across formation channels will provide insights into their population fractions, potentially enabling further constraints to be placed on the mechanisms producing these highly magnetised objects.
7. Conclusions
We have presented NIR observations of the counterpart of SGR 0501+4516, demonstrating that the NIR flux of the counterpart broadly follows the X-ray variability. Additionally, the long temporal baseline of our HST observations enabled us to measure the proper motion of the SGR, which corresponds to a low transverse peculiar velocity. The direction of the proper motion vector rules out an association with the nearby SNR HB9, and there is no star formation or reasonable alternative SNR located close to the SGR. This suggests that (i) SGR 0501+4516 is much older than typically anticipated for a magnetar, in contrast with recent modelling that indicates that SGR spin-down ages are overestimates, (ii) that the progenitor was a massive star but had a low supernova ejecta mass, or (iii) that it formed via a route that does not (directly) involve massive star core-collapse. SGR 0501+4516 therefore represents the best candidate currently known for a Galactic magnetar formed through the merger of two low-mass NSs or through the AIC of a magnetic WD.
Explanatory Supplement to the 2MASS All Sky Data Release and Extended Mission Products: http://www.ipac.caltech.edu/2mass/releases/allsky/doc/explsup.html
Acknowledgments
The authors thank Jos de Bruijne, David Green, and David O’Neill for helpful discussions, and the anonymous referee for their careful consideration of the manuscript. AAC acknowledges support through the European Space Agency (ESA) research fellowship programme. JDL acknowledges support from a UK Research and Innovation Fellowship(MR/T020784/1). VSD is supported by STFC. NRT is supported by STFC Consolidated grant ST/W000857/1. NR is supported by the European Research Council (ERC) via the Consolidator Grant “MAGNESIA” (No. 817661) and the Proof of Concept “DeepSpacePulse” (No. 101189496), by the Catalan grant SGR2021-01269, by the Spanish grant PID2023-153099NA-I00, and by the program Unidad de Excelencia Maria de Maeztu CEX2020-001058-M. DS acknowledges support from the Science and Technology Facilities Council (STFC, grant numbers ST/T007184/1, ST/T003103/1, ST/T000406/1 and ST/Z000165/1). The material is based upon work supported by NASA under award number 80GSFC24M0006. Observations analysed in this work were taken by the NASA/ESA Hubble Space Telescope under programs 12306, 12672 and 16019 (PI: Levan). This work made use of data from the European Space Agency (ESA) mission Gaia (https://www.cosmos.esa.int/Gaia), processed by the Gaia Data Processing and Analysis Consortium (DPAC, https://www.cosmos.esa.int/web/Gaia/dpac/consortium). Funding for the DPAC has been provided by national institutions, in particular the institutions participating in the Gaia Multilateral Agreement. This paper makes use of data obtained as part of the IGAPS merger of the IPHAS and UVEX surveys (http://www.igapsimages.org) carried out at the Isaac Newton Telescope (INT). The INT is operated on the island of La Palma by the Isaac Newton Group in the Spanish Observatorio del Roque de los Muchachos of the Instituto de Astrofisica de Canarias. All IGAPS data were processed by the Cambridge Astronomical Survey Unit, at the Institute of Astronomy in Cambridge. The uniformly-calibrated bandmerged IGAPS catalogue was assembled using the high performance computing cluster via the Centre for Astrophysics Research, University of Hertfordshire. The United Kingdom Infrared Telescope is operated by the Joint Astronomy Centre on behalf of the Science and Technology Facilities Council of the U.K. We thank Nancy Levison for awarding DDT observations with Gemini, and the ING group for their assistance with our observations at the WHT. The WHT is operated on the island of La Palma by the Isaac Newton Group in the Spanish Observatorio del Roque de los Muchachos of the Instituto de Astrofísica de Canarias. Based on observations obtained at the Gemini Observatory, which is operated by the Association of Universities for Research in Astronomy, Inc., under a cooperative agreement with the NSF on behalf of the Gemini partnership: the National Science Foundation (United States), the Science and Technology Facilities Council (United Kingdom), the National Research Council (Canada), CONICYT (Chile), the Australian Research Council (Australia), Ministério da Cióncia e Tecnologia (Brazil) and SECYT (Argentina). This publication makes use of data products from the Two Micron All Sky Survey, which is a joint project of the University of Massachusetts and the Infrared Processing and Analysis Center/California Institute of Technology, funded by the National Aeronautics and Space Administration and the National Science Foundation. This work made use of v2.2.1 of the Binary Population and Spectral Synthesis (BPASS) models as described in Eldridge et al. (2017) and Stanway & Eldridge (2018). This work has made use of IPYTHON (Perez & Granger 2007), NUMPY (Harris et al. 2020), SCIPY (Virtanen et al. 2020); MATPLOTLIB (Hunter 2007), Seaborn packages (Waskom 2021) and ASTROPY (https://www.astropy.org) a community-developed core Python package for Astronomy (Astropy Collaboration 2013); astropy:2018. We have also made use of the python modules DUSTMAPS (Green 2018) and EXTINCTION (Barbary 2016).
References
- Ablimit, I. 2022, MNRAS, 509, 6061 [Google Scholar]
- Aguilera-Miret, R., Palenzuela, C., Carrasco, F., & Viganò, D. 2023, Phys. Rev. D, 108, 103001 [NASA ADS] [CrossRef] [Google Scholar]
- Akmal, A., Pandharipande, V. R., & Ravenhall, D. G. 1998, Phys. Rev. C, 58, 1804 [Google Scholar]
- Anders, F., Khalatyan, A., Chiappini, C., et al. 2019, A&A, 628, A94 [NASA ADS] [CrossRef] [EDP Sciences] [Google Scholar]
- Anderson, L. D., Camilo, F., Faerber, T., et al. 2025, A&A, 693, A247 [NASA ADS] [CrossRef] [EDP Sciences] [Google Scholar]
- Astropy Collaboration (Robitaille, T. P., et al.) 2013, A&A, 558, A33 [NASA ADS] [CrossRef] [EDP Sciences] [Google Scholar]
- Bailes, M., Bassa, C. G., Bernardi, G., et al. 2021, MNRAS, 503, 5367 [Google Scholar]
- Barbary, K. 2016, https://doi.org/10.5281/zenodo.804967 [Google Scholar]
- Barrère, P., Guilet, J., Reboul-Salze, A., Raynaud, R., & Janka, H. T. 2022, A&A, 668, A79 [NASA ADS] [CrossRef] [EDP Sciences] [Google Scholar]
- Barrère, P., Guilet, J., Raynaud, R., & Reboul-Salze, A. 2025, A&A, 695, A183 [NASA ADS] [CrossRef] [EDP Sciences] [Google Scholar]
- Barthelmy, S. D., Baumgartner, W. H., Beardmore, A. P., et al. 2008a, ATel, 1676, 1 [Google Scholar]
- Barthelmy, S. D., Beardmore, A. P., Burrows, D. N., et al. 2008b, GRB Coordinates Network, 8113, 1 [NASA ADS] [Google Scholar]
- Bedin, L. R., & Fontanive, C. 2018, MNRAS, 481, 5339 [NASA ADS] [CrossRef] [Google Scholar]
- Beloborodov, A. M., & Thompson, C. 2007, ApJ, 657, 967 [Google Scholar]
- Beniamini, P., Hotokezaka, K., van der Horst, A., & Kouveliotou, C. 2019, MNRAS, 487, 1426 [NASA ADS] [CrossRef] [Google Scholar]
- Berger, E. 2014, ARA&A, 52, 43 [CrossRef] [Google Scholar]
- Bibby, J. L., Crowther, P. A., Furness, J. P., & Clark, J. S. 2008, MNRAS, 386, L23 [NASA ADS] [CrossRef] [Google Scholar]
- Blaauw, A. 1961, Bull. Astron. Inst. Netherlands, 15, 265 [NASA ADS] [Google Scholar]
- Bloom, J. S., Kulkarni, S. R., & Djorgovski, S. G. 2002, AJ, 123, 1111 [NASA ADS] [CrossRef] [Google Scholar]
- Bochenek, C. D., Ravi, V., Belov, K. V., et al. 2020, Nature, 587, 59 [NASA ADS] [CrossRef] [Google Scholar]
- Borkowski, K. J., & Reynolds, S. P. 2017, ApJ, 846, 13 [Google Scholar]
- Bray, J. C., & Eldridge, J. J. 2016, MNRAS, 461, 3747 [NASA ADS] [CrossRef] [Google Scholar]
- Burns, E., Svinkin, D., Hurley, K., et al. 2021, ApJ, 907, L28 [NASA ADS] [CrossRef] [Google Scholar]
- Camero, A., Papitto, A., Rea, N., et al. 2014, MNRAS, 438, 3291 [Google Scholar]
- Camilo, F., Ransom, S. M., Halpern, J. P., et al. 2006, Nature, 442, 892 [NASA ADS] [CrossRef] [Google Scholar]
- Camilo, F., Ransom, S. M., Peñalver, J., et al. 2007, ApJ, 669, 561 [Google Scholar]
- Cheng, S., Cummings, J. D., Ménard, B., & Toonen, S. 2020, ApJ, 891, 160 [CrossRef] [Google Scholar]
- Cheong, P. C.-K., Pitik, T., Longo Micchi, L. F., & Radice, D. 2025, ApJ, 978, L38 [Google Scholar]
- Chevalier, R. A., & Fransson, C. 2001, ApJ, 558, L27 [Google Scholar]
- CHIME/FRB Collaboration (Andersen, B. C., et al.) 2020, Nature, 587, 54 [Google Scholar]
- Chrimes, A. A., Levan, A. J., Fruchter, A. S., et al. 2022a, MNRAS, 513, 3550 [NASA ADS] [CrossRef] [Google Scholar]
- Chrimes, A. A., Levan, A. J., Fruchter, A. S., et al. 2022b, MNRAS, 512, 6093 [Google Scholar]
- Chrimes, A. A., Levan, A. J., Eldridge, J. J., et al. 2023, MNRAS, 522, 2029 [Google Scholar]
- Ciolfi, R., Kastaun, W., Giacomazzo, B., et al. 2017, Phys. Rev. D, 95, 063016 [Google Scholar]
- Clark, J. S., Ritchie, B. W., Najarro, F., Langer, N., & Negueruela, I. 2014, A&A, 565, A90 [NASA ADS] [CrossRef] [EDP Sciences] [Google Scholar]
- Coti Zelati, F., Rea, N., Pons, J. A., Campana, S., & Esposito, P. 2018, MNRAS, 474, 961 [NASA ADS] [CrossRef] [Google Scholar]
- Davies, B., Figer, D. F., Kudritzki, R.-P., et al. 2009, ApJ, 707, 844 [NASA ADS] [CrossRef] [Google Scholar]
- Deller, A. T., Camilo, F., Reynolds, J. E., & Halpern, J. P. 2012, ApJ, 748, L1 [NASA ADS] [CrossRef] [Google Scholar]
- De Luca, A., Caraveo, P. A., Mereghetti, S., Tiengo, A., & Bignami, G. F. 2006, Science, 313, 814 [NASA ADS] [CrossRef] [Google Scholar]
- de Luca, A., Caraveo, P. A., Esposito, P., & Hurley, K. 2009, ApJ, 692, 158 [Google Scholar]
- Dhillon, V. S., Marsh, T. R., Hulleman, F., et al. 2005, MNRAS, 363, 609 [Google Scholar]
- Dhillon, V. S., Marsh, T. R., Littlefair, S. P., et al. 2009, MNRAS, 394, L112 [NASA ADS] [CrossRef] [Google Scholar]
- Dhillon, V. S., Marsh, T. R., Littlefair, S. P., et al. 2011, MNRAS, 416, L16 [Google Scholar]
- Ding, H., Lower, M. E., Deller, A. T., et al. 2024, ApJ, 971, L13 [Google Scholar]
- Dolphin, A. E. 2000, PASP, 112, 1383 [Google Scholar]
- Drew, J. E., Greimel, R., Irwin, M. J., et al. 2005, MNRAS, 362, 753 [NASA ADS] [CrossRef] [Google Scholar]
- Duncan, R. C., & Thompson, C. 1992, ApJ, 392, L9 [Google Scholar]
- Durant, M., & van Kerkwijk, M. H. 2006a, ApJ, 650, 1070 [Google Scholar]
- Durant, M., & van Kerkwijk, M. H. 2006b, ApJ, 652, 576 [Google Scholar]
- Durant, M., & van Kerkwijk, M. H. 2006c, ApJ, 648, 534 [Google Scholar]
- Eftekhari, T., Dong, Y., Fong, W., et al. 2025, ApJ, 979, L22 [Google Scholar]
- Eldridge, J. J., Langer, N., & Tout, C. A. 2011, MNRAS, 414, 3501 [NASA ADS] [CrossRef] [Google Scholar]
- Eldridge, J. J., Stanway, E. R., Xiao, L., et al. 2017, PASA, 34, e058 [Google Scholar]
- Esposito, P., Rea, N., & Israel, G. L. 2021, in Timing Neutron Stars: Pulsations, Oscillations and Explosions, eds. T. M. Belloni, M. Méndez, & C. Zhang, Astrophys. Space Sci. Lib., 461, 97 [Google Scholar]
- Ferrario, L., & Wickramasinghe, D. 2006, MNRAS, 367, 1323 [NASA ADS] [CrossRef] [Google Scholar]
- Figer, D. F., Najarro, F., Geballe, T. R., Blum, R. D., & Kudritzki, R. P. 2005, ApJ, 622, L49 [Google Scholar]
- Fitzpatrick, E. L. 1999, PASP, 111, 63 [Google Scholar]
- Fruchter, A. S., & Hook, R. N. 2002, PASP, 114, 144 [NASA ADS] [CrossRef] [Google Scholar]
- Fryer, C., Benz, W., Herant, M., & Colgate, S. A. 1999, ApJ, 516, 892 [NASA ADS] [CrossRef] [Google Scholar]
- Gaensler, B. M., & Chatterjee, S. 2008, GRB Coordinates Network, 8149, 1 [Google Scholar]
- Gaensler, B. M., McClure-Griffiths, N. M., Oey, M. S., et al. 2005, ApJ, 620, L95 [NASA ADS] [CrossRef] [Google Scholar]
- Gaia Collaboration (Brown, A. G. A., et al.) 2021, A&A, 649, A1 [NASA ADS] [CrossRef] [EDP Sciences] [Google Scholar]
- Gaia Collaboration (Vallenari, A., et al.) 2023, A&A, 674, A1 [NASA ADS] [CrossRef] [EDP Sciences] [Google Scholar]
- Gerbrandt, S., Foster, T. J., Kothes, R., Geisbüsch, J., & Tung, A. 2014, A&A, 566, A76 [NASA ADS] [CrossRef] [EDP Sciences] [Google Scholar]
- Giacomazzo, B., & Perna, R. 2013, ApJ, 771, L26 [NASA ADS] [CrossRef] [Google Scholar]
- Giacomazzo, B., Zrake, J., Duffell, P. C., MacFadyen, A. I., & Perna, R. 2015, ApJ, 809, 39 [NASA ADS] [CrossRef] [Google Scholar]
- Gies, D. R., & Bolton, C. T. 1986, ApJS, 61, 419 [Google Scholar]
- Gogus, E., Woods, P., & Kouveliotou, C. 2008, ATel, 1677, 1 [Google Scholar]
- Göǧüş, E., Woods, P. M., Kouveliotou, C., et al. 2010, ApJ, 722, 899 [Google Scholar]
- Gordon, A. C., Fong, W.-F., Kilpatrick, C. D., et al. 2023, ApJ, 954, 80 [NASA ADS] [CrossRef] [Google Scholar]
- Götz, D., Mereghetti, S., Tiengo, A., & Esposito, P. 2006, A&A, 449, L31 [NASA ADS] [CrossRef] [EDP Sciences] [Google Scholar]
- Green, G. 2018, J. Open Source Software, 3, 695 [NASA ADS] [CrossRef] [Google Scholar]
- Green, D. A. 2019, JApA, 40, 36 [NASA ADS] [Google Scholar]
- Green, G. M., Schlafly, E., Zucker, C., Speagle, J. S., & Finkbeiner, D. 2019, ApJ, 887, 93 [NASA ADS] [CrossRef] [Google Scholar]
- Greimel, R., Drew, J. E., Monguió, M., et al. 2021, A&A, 655, A49 [NASA ADS] [CrossRef] [EDP Sciences] [Google Scholar]
- Gullón, M., Pons, J. A., Miralles, J. A., et al. 2015, MNRAS, 454, 615 [CrossRef] [Google Scholar]
- Hare, J., Pavlov, G. G., Posselt, B., et al. 2024, ApJ, 972, 176 [Google Scholar]
- Harris, C. R., Millman, K. J., van der Walt, S. J., et al. 2020, Nature, 585, 357 [NASA ADS] [CrossRef] [Google Scholar]
- Helfand, D. J., Chatterjee, S., Brisken, W. F., et al. 2007, ApJ, 662, 1198 [Google Scholar]
- Hobbs, G., Lorimer, D. R., Lyne, A. G., & Kramer, M. 2005, MNRAS, 360, 974 [Google Scholar]
- Hollands, M. A., Koester, D., Alekseev, V., Herbert, E. L., & Gänsicke, B. T. 2017, MNRAS, 467, 4970 [NASA ADS] [Google Scholar]
- Hulleman, F., Tennant, A. F., van Kerkwijk, M. H., et al. 2001, ApJ, 563, L49 [Google Scholar]
- Hunter, J. D. 2007, Comput. Sci. Eng., 9, 90 [NASA ADS] [CrossRef] [Google Scholar]
- Ibrahim, A. Y., Borghese, A., Rea, N., et al. 2023, ApJ, 943, 20 [Google Scholar]
- Israel, G. L., Covino, S., Stella, L., et al. 2002, ApJ, 580, L143 [Google Scholar]
- Israel, G., Covino, S., Mignani, R., et al. 2005, A&A, 438, L1 [NASA ADS] [CrossRef] [EDP Sciences] [Google Scholar]
- Jing, W. C., Han, J. L., Hong, T., et al. 2023, MNRAS, 523, 4949 [NASA ADS] [CrossRef] [Google Scholar]
- Kaplan, D. L., Chakrabarty, D., Wang, Z., & Wachter, S. 2009a, ApJ, 700, 149 [Google Scholar]
- Kaplan, D. L., Chatterjee, S., Hales, C. A., Gaensler, B. M., & Slane, P. O. 2009b, AJ, 137, 354 [Google Scholar]
- Kaspi, V. M., & Beloborodov, A. M. 2017, ARA&A, 55, 261 [Google Scholar]
- Kirsten, F., Snelders, M. P., Jenkins, M., et al. 2021, Nat. Astron., 5, 414 [Google Scholar]
- Kirsten, F., Marcote, B., Nimmo, K., et al. 2022, Nature, 602, 585 [NASA ADS] [CrossRef] [Google Scholar]
- Kiuchi, K., Cerdá-Durán, P., Kyutoku, K., Sekiguchi, Y., & Shibata, M. 2015, Phys. Rev. D, 92, 124034 [NASA ADS] [CrossRef] [Google Scholar]
- Kiuchi, K., Reboul-Salze, A., Shibata, M., & Sekiguchi, Y. 2024, Nat. Astron., 8, 298 [Google Scholar]
- Klose, S., Henden, A. A., Geppert, U., et al. 2004, ApJ, 609, L13 [Google Scholar]
- Kosugi, G., Ogasawara, R., & Terada, H. 2005, ApJ, 623, L125 [Google Scholar]
- Kouveliotou, C., Dieters, S., Strohmayer, T., et al. 1998, Nature, 393, 235 [NASA ADS] [CrossRef] [Google Scholar]
- Kouveliotou, C., Strohmayer, T., Hurley, K., et al. 1999, ApJ, 510, L115 [NASA ADS] [CrossRef] [Google Scholar]
- Kremer, K., Piro, A. L., & Li, D. 2021, ApJ, 917, L11 [NASA ADS] [CrossRef] [Google Scholar]
- Kulkarni, S., Padamata, S., Gupta, A., Radice, D., & Kashyap, R. 2023, Phys. Rev. D, 108, 103023 [Google Scholar]
- Lackey, B. D., Nayyar, M., & Owen, B. J. 2006, Phys. Rev. D, 73, 024021 [Google Scholar]
- Leahy, D. A., & Roger, R. S. 1996, A&AS, 115, 345 [Google Scholar]
- Leahy, D. A., & Tian, W. W. 2007, A&A, 461, 1013 [NASA ADS] [CrossRef] [EDP Sciences] [Google Scholar]
- Levan, A. J., Wynn, G. A., Chapman, R., et al. 2006, MNRAS, 368, L1 [NASA ADS] [CrossRef] [Google Scholar]
- Levan, A., Kouveliotou, C., & Fruchter, A. 2018, ApJ, 854, 161 [Google Scholar]
- Lucas, P. W., Hoare, M. G., Longmore, A., et al. 2008, MNRAS, 391, 136 [Google Scholar]
- Lyman, J. D., Levan, A. J., Wiersema, K., et al. 2022, ApJ, 926, 121 [Google Scholar]
- Manchester, R. N., Hobbs, G. B., Teoh, A., & Hobbs, M. 2005, AJ, 129, 1993 [Google Scholar]
- Margalit, B., & Metzger, B. D. 2018, ApJ, 868, L4 [NASA ADS] [CrossRef] [Google Scholar]
- Margalit, B., Berger, E., & Metzger, B. D. 2019, ApJ, 886, 110 [NASA ADS] [CrossRef] [Google Scholar]
- Marsden, D., Lingenfelter, R. E., Rothschild, R. E., & Higdon, J. C. 2001, ApJ, 550, 397 [NASA ADS] [CrossRef] [Google Scholar]
- Martin, J., Rea, N., Torres, D. F., & Papitto, A. 2014, MNRAS, 444, 2910 [NASA ADS] [CrossRef] [Google Scholar]
- Mazets, E. P., Golentskii, S. V., Ilinskii, V. N., Aptekar, R. L., & Guryan, I. A. 1979, Nature, 282, 587 [NASA ADS] [CrossRef] [Google Scholar]
- Mazets, E. P., Cline, T. L., Aptekar’, R. L., et al. 1999, Astronomy Letters, 25, 635 [Google Scholar]
- Mereghetti, S. 2008, A&A Rev., 15, 225 [NASA ADS] [CrossRef] [Google Scholar]
- Mereghetti, S. 2013, Braz. J. Phys., 43, 356 [Google Scholar]
- Mereghetti, S., Savchenko, V., Ferrigno, C., et al. 2020, ApJ, 898, L29 [Google Scholar]
- Mereghetti, S., Rigoselli, M., Salvaterra, R., et al. 2024, Nature, 629, 58 [NASA ADS] [CrossRef] [Google Scholar]
- Metzger, B. D., Quataert, E., & Thompson, T. A. 2008, MNRAS, 385, 1455 [CrossRef] [Google Scholar]
- Mikkola, D., McMillan, P. J., Hobbs, D., & Wimarsson, J. 2022, MNRAS, 512, 6201 [CrossRef] [Google Scholar]
- Mondal, T. 2021, ApJ, 913, L12 [Google Scholar]
- Motch, C., Pires, A. M., Haberl, F., & Schwope, A. 2007, Ap&SS, 308, 217 [Google Scholar]
- Muno, M. P., Clark, J. S., Crowther, P. A., et al. 2006, ApJ, 636, L41 [NASA ADS] [CrossRef] [Google Scholar]
- Muñoz-Darias, T., de Ugarte Postigo, A., & Casares, J. 2016, MNRAS, 458, L114 [Google Scholar]
- Narita, T., Uchida, H., Yoshida, T., Tanaka, T., & Tsuru, T. G. 2023, ApJ, 950, 137 [CrossRef] [Google Scholar]
- Nelemans, G., Yungelson, L. R., Portegies Zwart, S. F., & Verbunt, F. 2001, A&A, 365, 491 [NASA ADS] [CrossRef] [EDP Sciences] [Google Scholar]
- Nomoto, K. 1987, ApJ, 322, 206 [NASA ADS] [CrossRef] [Google Scholar]
- Nomoto, K., & Kondo, Y. 1991, ApJ, 367, L19 [NASA ADS] [CrossRef] [Google Scholar]
- Nomoto, K., Miyaji, S., Sugimoto, D., & Yokoi, K. 1979, in IAU Colloq. 53: White Dwarfs and Variable Degenerate Stars, eds. H. M. van Horn, V. Weidemann, & M. P. Savedoff, 56 [Google Scholar]
- Olausen, S. A., & Kaspi, V. M. 2014, ApJS, 212, 6 [Google Scholar]
- Oppenheimer, J. R., & Volkoff, G. M. 1939, Phys. Rev., 55, 374 [NASA ADS] [CrossRef] [Google Scholar]
- Palenzuela, C., Aguilera-Miret, R., Carrasco, F., et al. 2022, Phys. Rev. D, 106, 023013 [NASA ADS] [CrossRef] [Google Scholar]
- Palmer, D. M., Barthelmy, S., Gehrels, N., et al. 2005, Nature, 434, 1107 [NASA ADS] [CrossRef] [Google Scholar]
- Perez, F., & Granger, B. E. 2007, Comput. Sci. Eng., 9, 21 [Google Scholar]
- Perna, R., Hernquist, L., & Narayan, R. 2000, ApJ, 541, 344 [Google Scholar]
- Piro, A. L., Giacomazzo, B., & Perna, R. 2017, ApJ, 844, L19 [NASA ADS] [CrossRef] [Google Scholar]
- Pizzolato, F., Colpi, M., De Luca, A., Mereghetti, S., & Tiengo, A. 2008, ApJ, 681, 530 [Google Scholar]
- Popov, S. B. 2016, Astron. Astrophys. Trans., 29, 183 [NASA ADS] [Google Scholar]
- Poveda, A., Ruiz, J., & Allen, C. 1967, Boletin de los Observatorios Tonantzintla y Tacubaya, 4, 86 [Google Scholar]
- Prasanna, T., Coleman, M. S. B., Raives, M. J., & Thompson, T. A. 2022, MNRAS, 517, 3008 [Google Scholar]
- Predehl, P., & Schmitt, J. H. M. M. 1995, A&A, 293, 889 [NASA ADS] [Google Scholar]
- Price-Whelan, A. M., Sipőcz, B. M., Günther, H. M., et al. 2018, AJ, 156, 123 [NASA ADS] [CrossRef] [Google Scholar]
- Raddi, R., Torres, S., Rebassa-Mansergas, A., et al. 2022, A&A, 658, A22 [NASA ADS] [CrossRef] [EDP Sciences] [Google Scholar]
- Rea, N., Testa, V., Israel, G. L., et al. 2004, A&A, 425, L5 [NASA ADS] [CrossRef] [EDP Sciences] [Google Scholar]
- Rea, N., Israel, G. L., Turolla, R., et al. 2009, MNRAS, 396, 2419 [NASA ADS] [CrossRef] [Google Scholar]
- Rea, N., Gullón, M., Pons, J. A., et al. 2015, ApJ, 813, 92 [Google Scholar]
- Rea, N., Borghese, A., Esposito, P., et al. 2016, ApJ, 828, L13 [NASA ADS] [CrossRef] [Google Scholar]
- Reboul-Salze, A., Barrère, P., Kiuchi, K., et al. 2024, arXiv e-prints [arXiv:2411.19328] [Google Scholar]
- Renzo, M., Zapartas, E., de Mink, S. E., et al. 2019, A&A, 624, A66 [NASA ADS] [CrossRef] [EDP Sciences] [Google Scholar]
- Rigoselli, M., Mereghetti, S., Halpern, J. P., Gotthelf, E. V., & Bassa, C. G. 2024, ApJ, 976, 228 [Google Scholar]
- Rowlinson, A., de Ruiter, I., Starling, R. L. C., et al. 2024, MNRAS, 534, 2592 [Google Scholar]
- Ruiter, A. J., Ferrario, L., Belczynski, K., et al. 2019, MNRAS, 484, 698 [NASA ADS] [CrossRef] [Google Scholar]
- Sana, H., Le Bouquin, J. B., Lacour, S., et al. 2014, ApJS, 215, 15 [Google Scholar]
- Sarin, N., Clarke, T. A., Magnall, S. J., et al. 2024, ApJ, 973, L20 [Google Scholar]
- Sawai, H., Kotake, K., & Yamada, S. 2008, ApJ, 672, 465 [Google Scholar]
- Schady, P., de Pasquale, M., Page, M. J., et al. 2008, in Gamma-ray Bursts 2007, eds. M. Galassi, D. Palmer, & E. Fenimore, (AIP), AIP Conf. Ser., 1000, 200 [Google Scholar]
- Schlafly, E. F., & Finkbeiner, D. P. 2011, ApJ, 737, 103 [Google Scholar]
- Schlegel, D. J., Finkbeiner, D. P., & Davis, M. 1998, ApJ, 500, 525 [Google Scholar]
- Schneider, F. R. N., Ohlmann, S. T., Podsiadlowski, P., et al. 2020, MNRAS, 495, 2796 [NASA ADS] [CrossRef] [Google Scholar]
- Shah, V., Shin, K., Leung, C., et al. 2025, ApJ, 979, L21 [Google Scholar]
- Shannon, R. M., & Johnston, S. 2013, MNRAS, 435, L29 [Google Scholar]
- Sharma, K., Somalwar, J., Law, C., et al. 2023, ApJ, 950, 175 [Google Scholar]
- Shen, H., Toki, H., Oyamatsu, K., & Sumiyoshi, K. 1998, Nucl. Phys. A, 637, 435 [Google Scholar]
- Shen, G., Horowitz, C. J., & Teige, S. 2011, Phys. Rev. C, 83, 035802 [NASA ADS] [CrossRef] [Google Scholar]
- Shenar, T., Wade, G. A., Marchant, P., et al. 2023, Science, 381, 761 [NASA ADS] [CrossRef] [Google Scholar]
- Sherman, M. B., Ravi, V., El-Badry, K., et al. 2024, MNRAS, 531, 2379 [Google Scholar]
- Sidharth, A. V., Shridharan, B., Mathew, B., et al. 2024, A&A, 690, A68 [NASA ADS] [CrossRef] [EDP Sciences] [Google Scholar]
- Skrutskie, M. F., Cutri, R. M., Stiening, R., et al. 2006, AJ, 131, 1163 [NASA ADS] [CrossRef] [Google Scholar]
- Spruit, H. C. 2008, in 40 Years of Pulsars: Millisecond Pulsars, Magnetars and More, eds. C. Bassa, Z. Wang, A. Cumming, & V. M. Kaspi (AIP), AIP Conf. Ser., 983, 391 [Google Scholar]
- Stanway, E. R., & Eldridge, J. J. 2018, MNRAS, 479, 75 [NASA ADS] [CrossRef] [Google Scholar]
- Tauris, T. M., Sanyal, D., Yoon, S. C., & Langer, N. 2013, A&A, 558, A39 [NASA ADS] [CrossRef] [EDP Sciences] [Google Scholar]
- Tauris, T. M., Langer, N., & Podsiadlowski, P. 2015, MNRAS, 451, 2123 [NASA ADS] [CrossRef] [Google Scholar]
- Taylor, A. R., Gibson, S. J., Peracaula, M., et al. 2003, AJ, 125, 3145 [NASA ADS] [CrossRef] [Google Scholar]
- Tendulkar, S. P., Cameron, P. B., & Kulkarni, S. R. 2012, ApJ, 761, 76 [Google Scholar]
- Tendulkar, S. P., Cameron, P. B., & Kulkarni, S. R. 2013, ApJ, 772, 31 [Google Scholar]
- Testa, V., Rea, N., Mignani, R. P., et al. 2008, A&A, 482, 607 [NASA ADS] [CrossRef] [EDP Sciences] [Google Scholar]
- Testa, V., Mignani, R. P., Hummel, W., Rea, N., & Israel, G. L. 2018, MNRAS, 473, 3180 [Google Scholar]
- Thompson, C., & Duncan, R. C. 1993, ApJ, 408, 194 [NASA ADS] [CrossRef] [Google Scholar]
- Tody, D. 1986, in Instrumentation in astronomy VI, ed. D. L. Crawford, SPIE Conf. Ser., 627, 733 [Google Scholar]
- Tong, H., Wang, W., Liu, X. W., & Xu, R. X. 2016, ApJ, 833, 265 [Google Scholar]
- van der Horst, A. J., Connaughton, V., Kouveliotou, C., et al. 2010, ApJ, 711, L1 [Google Scholar]
- Verbunt, F., Igoshev, A., & Cator, E. 2017, A&A, 608, A57 [NASA ADS] [CrossRef] [EDP Sciences] [Google Scholar]
- Vink, J., & Kuiper, L. 2006, MNRAS, 370, L14 [NASA ADS] [CrossRef] [Google Scholar]
- Virtanen, P., Gommers, R., Oliphant, T. E., et al. 2020, Nat. Methods, 17, 261 [Google Scholar]
- Vrba, F. J., Henden, A. A., Luginbuhl, C. B., et al. 2000, ApJ, 533, L17 [Google Scholar]
- Wang, Z., Chakrabarty, D., & Kaplan, D. L. 2006, Nature, 440, 772 [Google Scholar]
- Waskom, M. L. 2021, J. Open Source Software, 6, 3021 [NASA ADS] [CrossRef] [Google Scholar]
- White, C. J., Burrows, A., Coleman, M. S. B., & Vartanyan, D. 2022, ApJ, 926, 111 [NASA ADS] [CrossRef] [Google Scholar]
- Woods, P. M., Gogus, E., & Kouveliotou, C. 2008, ATel, 1691, 1 [Google Scholar]
- Xu, K., & Li, X.-D. 2019, ApJ, 877, 138 [Google Scholar]
- Yoon, S. C., Podsiadlowski, P., & Rosswog, S. 2007, MNRAS, 380, 933 [Google Scholar]
- Zane, S., Turolla, R., Nobili, L., & Rea, N. 2011, Adv. Space Res., 47, 1298 [Google Scholar]
- Zhou, P., Zhou, X., Chen, Y., et al. 2020, ApJ, 905, 99 [NASA ADS] [CrossRef] [Google Scholar]
All Tables
Differential photometry of SGR 0501+4516 relative to 2MASS stars within the field of view of NIRI, UFTI, and LIRIS, plus HST NIR magnitudes for SGR 0501+4516 in 2010, 2012, and 2020 (given in the last four rows).
All Figures
|
Fig. 1. NIR image (JHK bands) of the field of SGR 0501+4516 as imaged with Gemini/NIRI (see Table 1). SGR 0501+4516 is marked with crosshairs and is notably redder than the surrounding field stars. The image has dimensions 45 × 36 arcsec and is oriented north up, east left. |
| In the text | |
|
Fig. 2. NIR and X-ray light curve of SGR 0501+4516 up to ∼500 days post-discovery in 2008. The red points correspond to the NIR and the blue to the X-ray data from Rea et al. (2009), supplemented with later Swift observations (Coti Zelati et al. 2018). The cyan shaded box represents the ROSAT quiescent level and its associated error (also from Rea et al. 2009). All X-ray fluxes are reduced by a factor of 10 for clarity. The dashed green and solid blue lines are broken power-law fits to the NIR and X-ray data, respectively (see Sect. 3.1). Due to the difficulty of fully accounting for colour terms between the Ks and K bands, we have plotted only the K-band observations (red points and solid green line). In faded red and with a dashed green line is the K-band light curve fit after the subtraction of an approximate quiescent flux level, as described in the text. The X-ray light curve is plotted as a specific flux (Fν) at 1 keV based on the spectral model and count rate obtained from XMM-Newton observations in the 0.3–10 keV range; it assumes no X-ray spectral variability, although such effects would have only a small impact on the observed flux in any case. |
| In the text | |
|
Fig. 3. Top: Spectral energy distribution of SGR 0501+4516 from the X-ray to the NIR as measured one day after the first outburst. The X-ray spectra were obtained by XMM-Newton. We show NIR observations without extinction correction (lower, red points) and with extinction correction (upper, blue points) assuming a total Galactic E(B − V) = 1.3 in that direction. The true extinction will lie between these extremes (see Fig. 4). Bottom: K-band and X-ray spectral energy distribution at ∼200 days. In grey are the late-time i-band flux level (Dhillon et al. 2011) and the F125W and F160W HST fluxes from the 2020 epoch. In both panels, the X-ray data are fitted with the models from Rea et al. (2009, cyan lines). Unabsorbed (and extrapolated) versions of these models are shown with magenta lines. |
| In the text | |
|
Fig. 4. Visual extinction, AV, as a function of distance along the sight line to SGR 0501+4516. The solid black line is the best-fit Green et al. (2019) Bayestar 3D dust map extinction along the sight line. Dashed grey lines are random draws from the Bayestar probability distribution. Also shown are the total sight-line extinctions from Schlegel et al. (1998) and Schlafly & Finkbeiner (2011). The Bayestar flattening at ∼3.5–4 kpc corresponds to the point at which main sequence stars can no longer be detected (and the extinction estimate becomes unreliable). The distance to SGR 0501+4516 is unknown, but we assumed it lies at ∼2 kpc, in the Perseus spiral arm. |
| In the text | |
|
Fig. 5. Left: Offsets of SGR 0501+4516 in 2D-projected equatorial coordinates in each of the three HST epochs (note that epoch 2020.6 has observations in two filters) with respect to the mean position across all four sets of observations. Dark and light shaded ellipses correspond to the 1 and 3 σ uncertainties, respectively. Right: Linear fits to positional offsets of SGR 0501+4516 in α⋆ and δ, including corrections for solar and Galactic motion, as a function of time. The uncertainties on the points show the overall positional uncertainties on SGR 0501+4516 at each epoch, including residuals from the astrometric tie to the Gaia Early Data Release 3 reference frame. The two 2020 points are from the two filters, and the rightmost marker in the right-hand panels has been arbitrarily shifted by 0.15 years for visual clarity. The best-fit proper motions in each coordinate are indicated, and a shaded region indicates the 1σ uncertainty on the fit. |
| In the text | |
|
Fig. 6. Cumulative distribution of the nine magnetar peculiar transverse velocities, including SGR 0501+4516, measured so far. These measurements are for XTE J1810-197 (VLBI; Helfand et al. 2007), 1E 1547.0-5408 (VLBI; Deller et al. 2012), SGRs 1806-20 and 1900+15 (NIR; Tendulkar et al. 2012), AXPs 1E 2259+586 and 4U0142+61 (NIR; Tendulkar et al. 2013), SGR 1935+2154 (NIR; Lyman et al. 2022), Swift J1818.0-1607 (Ding et al. 2024, VLBI), and SGR 0501+4516 (this work). Multiple draws from each magnetar’s velocity probability distribution are made, assuming Gaussian uncertainties on the velocities. The same process is applied to the pulsar distribution in grey (data from Verbunt et al. 2017). SGR 0501+4516, whose velocity range for distances between 1 and 3 kpc is indicated by the shaded band, is the joint-slowest magnetar yet discovered, at least in projection, and is among the slowest ∼10% of pulsars with similar measurements. |
| In the text | |
|
Fig. 7. Possible range of past trajectories of SGR 0501+4516 based on the proper motion as measured with HST. Left: HST/WFC3 F160W image of the field surrounding SGR 0501+4516. The possible past trajectories of SGR 0501+4516 are indicated by the light green transparent lines. These are random draws from the RA and Dec proper motion distribution, defined by their best-fit values and uncertainties (assuming these are Gaussian), multiplied by an age of τ ∼ 10 kyr. Middle: Same but for a wider field of view and IPHAS Hα imaging. The past trajectory over 105 years is shown in red, and the trajectory of 104 years (same as in the left panel) is shown in green. A dashed circle with radius 15 kyr × 5.4 mas yr−1 is also shown. Right: Wide-field 1.4 GHz image from the Canadian Galactic Plane Survey. The trajectory over 1Myr is shown in light blue (105 again in red), demonstrating that SGR 0501+4516 and SNR HB9 are not physically associated. In each case, the field of view of the previous panel is shown. As discussed in the text, there is no evidence of any region of intense star formation within this area that might have given rise to the progenitor star of SGR 0501+4516. The dark points on the radio image are compact sources, the vast majority of which are believed to be extragalactic (Leahy & Roger 1996). |
| In the text | |
|
Fig. 8. Left: Product of overlapping elliptical 2D Gaussians, representing the positional uncertainty of SGR 0501+4516 and Gaia sources in the vicinity, as a function of time. Only sources with 1D radial separations with more than 3σ significance are shown. We find two Gaia objects that meet this criterion (orange and blue). The grey lines are Gaia matches found when the SGR proper motion vector is rotated by 90, 180, and 270 degrees. The ‘real’ matches are not obviously distinct from the false or random matches. Right: Two ‘real’ matches, with their extinction-corrected absolute magnitudes (based on their best parallax distances and extinction at that distance in the Bayestar 2019 dust map) plotted against their peculiar transverse velocity. Their Gaia DR3 IDs are labelled. Binary population synthesis predictions for the properties of stars ejected by the supernova of a binary companion are shown with the grey shading (Chrimes et al. 2023), where each contour moving from dark to light grey bounds 10% more of the probability. |
| In the text | |
Current usage metrics show cumulative count of Article Views (full-text article views including HTML views, PDF and ePub downloads, according to the available data) and Abstracts Views on Vision4Press platform.
Data correspond to usage on the plateform after 2015. The current usage metrics is available 48-96 hours after online publication and is updated daily on week days.
Initial download of the metrics may take a while.