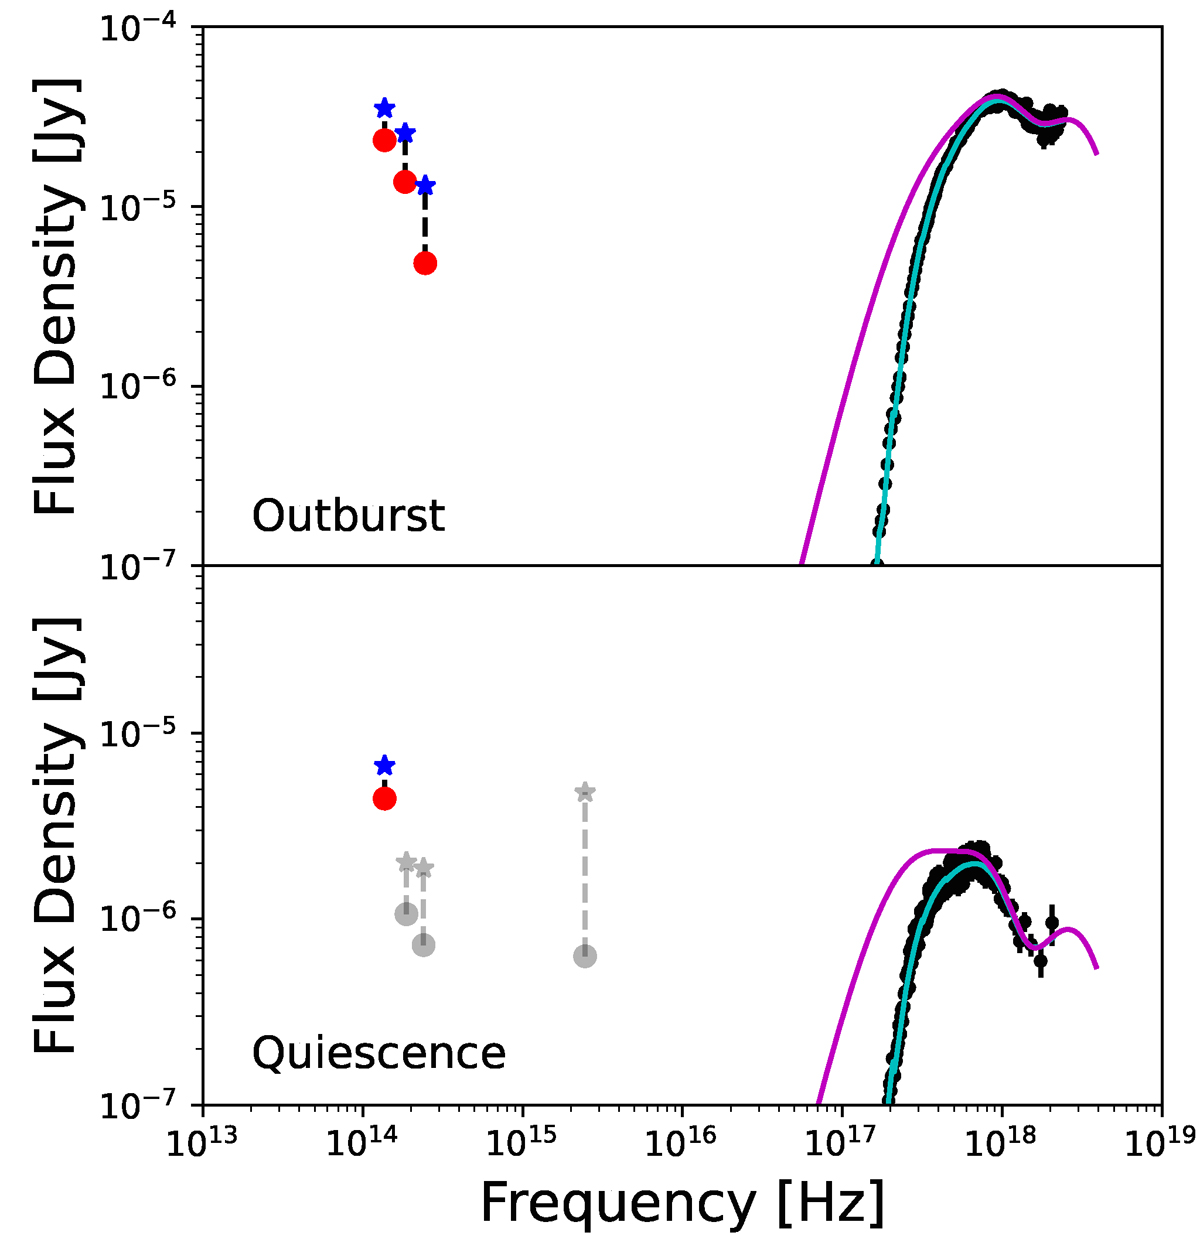
Fig. 3.
Download original image
Top: Spectral energy distribution of SGR 0501+4516 from the X-ray to the NIR as measured one day after the first outburst. The X-ray spectra were obtained by XMM-Newton. We show NIR observations without extinction correction (lower, red points) and with extinction correction (upper, blue points) assuming a total Galactic E(B − V) = 1.3 in that direction. The true extinction will lie between these extremes (see Fig. 4). Bottom: K-band and X-ray spectral energy distribution at ∼200 days. In grey are the late-time i-band flux level (Dhillon et al. 2011) and the F125W and F160W HST fluxes from the 2020 epoch. In both panels, the X-ray data are fitted with the models from Rea et al. (2009, cyan lines). Unabsorbed (and extrapolated) versions of these models are shown with magenta lines.
Current usage metrics show cumulative count of Article Views (full-text article views including HTML views, PDF and ePub downloads, according to the available data) and Abstracts Views on Vision4Press platform.
Data correspond to usage on the plateform after 2015. The current usage metrics is available 48-96 hours after online publication and is updated daily on week days.
Initial download of the metrics may take a while.