Fig. 2.
Download original image
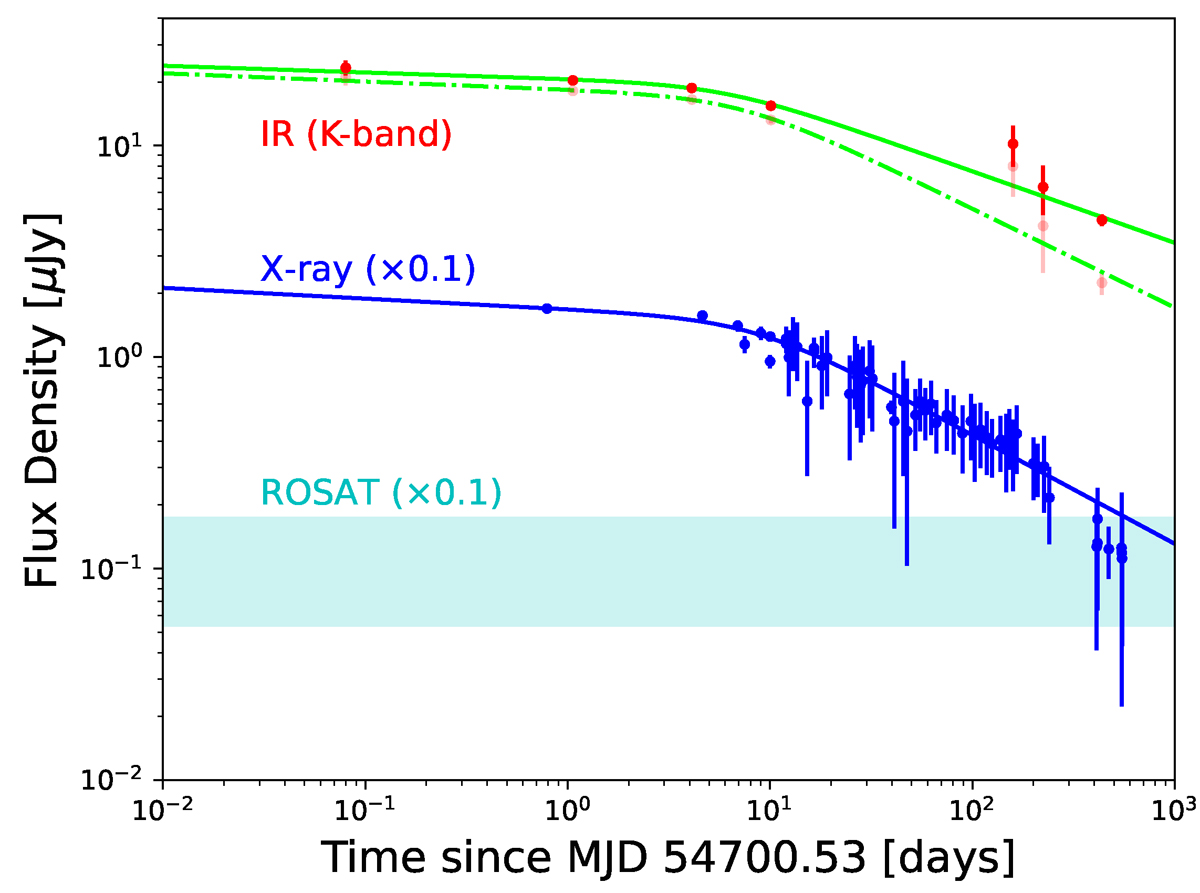
NIR and X-ray light curve of SGR 0501+4516 up to ∼500 days post-discovery in 2008. The red points correspond to the NIR and the blue to the X-ray data from Rea et al. (2009), supplemented with later Swift observations (Coti Zelati et al. 2018). The cyan shaded box represents the ROSAT quiescent level and its associated error (also from Rea et al. 2009). All X-ray fluxes are reduced by a factor of 10 for clarity. The dashed green and solid blue lines are broken power-law fits to the NIR and X-ray data, respectively (see Sect. 3.1). Due to the difficulty of fully accounting for colour terms between the Ks and K bands, we have plotted only the K-band observations (red points and solid green line). In faded red and with a dashed green line is the K-band light curve fit after the subtraction of an approximate quiescent flux level, as described in the text. The X-ray light curve is plotted as a specific flux (Fν) at 1 keV based on the spectral model and count rate obtained from XMM-Newton observations in the 0.3–10 keV range; it assumes no X-ray spectral variability, although such effects would have only a small impact on the observed flux in any case.
Current usage metrics show cumulative count of Article Views (full-text article views including HTML views, PDF and ePub downloads, according to the available data) and Abstracts Views on Vision4Press platform.
Data correspond to usage on the plateform after 2015. The current usage metrics is available 48-96 hours after online publication and is updated daily on week days.
Initial download of the metrics may take a while.