| Issue |
A&A
Volume 659, March 2022
|
|
|---|---|---|
| Article Number | A103 | |
| Number of page(s) | 10 | |
| Section | Catalogs and data | |
| DOI | https://doi.org/10.1051/0004-6361/202142307 | |
| Published online | 11 March 2022 | |
Detections of inflowing gas from narrow absorption lines at parsec scales
1
Department of physics, Guangxi University for Nationalities, Nanning 530006, PR China
e-mail: zhichenfu@126.com
2
Key Laboratory for Research in Galaxies and Cosmology, Shanghai Astronomical Observatory, Chinese Academy of Sciences, Shanghai 200030, PR China
e-mail: gumf@shao.ac.cn
3
School of Astronomy and Space Science, University of Science and Technology of China, Hefei, PR China
e-mail: zcho@ustc.edu.cn
4
School of Astronomy and Space Science, Nanjing University, Nanjing 210093, PR China
5
Center for Astrophysics, Guangzhou University, Guangzhou 510006, PR China
6
School of Materials Science and Engineering, Baise University, Baise 533000, PR China
Received:
25
September 2021
Accepted:
13
December 2021
The detection of inflows at the scale of the dusty torus and smaller is crucial for investigating the process of supermassive black hole (SMBH) accretion. However, only a few cases of inflowing gas at small scales have been reported through redshifted broad absorption lines so far. Here we report nine redshifted narrow absorption lines (NALs) of Mg+ ions with inflowing speeds of 1071–1979 km s−1, which are likely along the directions close to the axes of accretion disks. The quasars showing inflowing Mg II NALs have, on average, slightly smaller Eddington ratios than the sources with outflowing Mg II NALs. The upper limits on the locations of the detected NALs are at parsec scale, that is, the distance from dusty tori to their central SMBHs. One possible origin of these infalling NALs is from dusty tori. However, these infalling NALs could also be naturally explained by chaotic cold accretion resulting from the nonlinear interaction of active galactic nucleus (AGN) jets with the interstellar medium (ISM), and these cold gaseous blobs may originally precipitate in metal-rich trailing outflows uplifted by AGN jet ejecta. The infalling NALs may therefore provide direct evidence for cold gas precipitation and accretion in AGN feedback processes, and provide direct evidence of inflowing gas along the directions close to quasar jets and at parsec scale. Regardless of whether these infalling NALs are from the dusty tori or the interaction of AGN jets with the ISM, the infalling NALs cannot provide sufficient fuel to power the quasars.
Key words: galaxies: active / quasars: absorption lines / methods: data analysis
© ESO 2022
1. Introduction
Quasars are some of the brightest astronomical objects and are powered by the accretion disks surrounding supermassive black holes (SMBHs). Numerous studies based on diverse evidence (e.g., Ferrarese & Merritt 2000; Gu et al. 2009; Aird et al. 2010; Madau & Dickinson 2014) have revealed that SMBHs and their host galaxies co-evolve (e.g., Kormendy & Ho 2013; Heckman & Best 2014). Fueling and feedback are fundamental processes resulting in the co-evolution of SMBHs and galaxies. In the form of jets, outflows, winds, and radiation, quasar feedback might heat and disperse the gas from the central region of the host galaxy (e.g., Elvis 2000; Gaspari & Sądowski 2017). This process likely compresses the star formation within the host galaxy, regulates the galaxy growth to be become overmassive, and impacts the surrounding circumgalactic medium (CGM) and intergalactic medium (IGM).
The trigger of nuclear activity requires gas supply – from a fraction to dozens of solar masses per year (e.g., Netzer 2013; Storchi-Bergmann & Schnorr-Müller 2019) – to feed the active galactic nucleus (AGN). Although galaxy interactions and mergers can efficiently trigger and feed quasars (e.g., Simões Lopes et al. 2007; Treister et al. 2012; Menci et al. 2014; Gatti et al. 2015; Gaspari & Sądowski 2017; Storchi-Bergmann & Schnorr-Müller 2019), some fundamental questions remain unanswered, such as how the accretion disks are supplied with external gas, whether or not all the inflowing gas reaches the accretion disk, and where the inflowing gas originates from. The answers to these questions will benefit our comprehension of the fueling and feedback mechanisms and processes of quasars. Therefore, observational evidence of inflows at scales of the dusty torus and smaller (less than several tens of parsecs) is crucial to studying the process of SMBH accretion. Cold clouds in outflows, winds, and the surrounding CGM will condense and fall back toward central regions, providing material for broad emission line regions and central black holes (e.g., Gaspari et al. 2013; Li & Bryan 2014; Elvis 2017; Gaspari & Sądowski 2017). Many previous works have suggested inflowing clouds in and/or around the broad emission line region of quasars (e.g., Hu et al. 2008; Ferland et al. 2009; Gaskell & Goosmann 2013, 2016; Grier et al. 2017). However, until now, only a few cases (e.g., Hall et al. 2013; Shi et al. 2017; Zhang et al. 2017; Zhou et al. 2019) of inflowing gas at these scales have been reported through redshifted broad absorption lines (BALs), where the BALs are the hosting continual absorption features with line widths > 2000 km s−1 at depths > 10% below the continuum (Weymann et al. 1979), and are likely close to the equatorial plane of the accretion disk. In addition, unambiguous observational evidence is still lacking for inflowing gas detected through metal narrow absorption line systems (NALs) in quasar spectra, where the NALs are the absorption features with line widths of less than a few km s−1, and are likely along the directions close to the axes of accretion disks (Hamann et al. 2012). In theory, clouds with enough column density of gas, which intercept quasar sightlines, could leave absorption features in quasar spectra. If the absorbing gas cloud falls toward the quasar central region (accretion disk), we can observe inflowing (redshifted) absorption features. This lack of redshifted metal NALs can be ascribed to several factors. The first is the quasar systemic redshift, which is required to be robust and accurate. If the quasar redshift is determined from broad emission lines, especially from the highly ionized C IV, there may be large uncertainty on the quasar redshift (e.g., Shen et al. 2011), which often leads to misidentification of inflowing NALs. A second factor is that NALs should be identified through at least three robust lines at the same redshift, which significantly reduces their sample size. If a NAL is only confirmed through N Vλλ1238,1242, C IVλλ1548,1551, or the Mg IIλλ2796,2803 resonance doublet, the probability of false absorption line systems cannot be ignored. A third factor is that the radiation from quasar central regions is strong along the directions close to the axes of accretion disks. Most of the inflowing gas clouds, which are expected to produce NALs along the directions close to the axes of accretion disks, are likely transformed into outflows by the strong quasar radiation when they reach hundreds of gravitational radii from SMBHs (Gaspari & Sądowski 2017). This would significantly reduce the incidence of inflowing NALs. Therefore, inflowing NALs with a high level of significance are very difficult to identify.
Here we report a sample of nine redshifted NAL systems whose locations, or rather the upper limits thereof, are around the dusty tori. The inflowing NALs possibly provide direct evidence for cold-gas precipitation and accretion in AGN feedback processes, and provide the first direct evidence of inflowing gas along the directions close to quasar jets and at the parsec scale. In this paper, we adopt the ΛCDM cosmology with ΩM = 0.3, ΩΛ = 0.7, and H0 = 70 km s−1 Mpc−1.
2. Data sample and spectral analysis
We aim to study quasar inflows through NALs imprinted in quasar spectra. Therefore, we first select Mg II NALs with υr < 0 from the largest catalog of quasar Mg II-associated absorption lines (Chen et al. 2018a), which were detected from about 105 quasar spectra of the Sloan Digital Sky Survey (SDSS, Pâris et al. 2017). Here
where the zabs is the absorption line redshift, zem is the quasar systemic redshift, and c is the speed of light. Generally speaking, an absorber with υr < 0 means that it is likely falling into the central region of a quasar. The zabs, which is measured from the narrow absorption line, is accurate. However, because of certain mechanisms, such as quasar outflow, the zem, which is determined from quasar emission lines, is usually lower than the true value. Therefore, an accurate quasar systemic reshift is required in order to define an inflow absorber by the velocity offset between zem and zabs. The quasar systemic redshift determined from narrow emission lines, such as [O II], is more accurate than that estimated from broad emission lines. Therefore, we further limit our absorber sample to the Mg II NALs, which were detected in the quasar spectra showing obvious [O II] emission features. Meanwhile, we determine all the quasar systemic redshifts by fitting the [O II] emission features.
Chen et al. (2018a) identified a Mg II absorption line system using only the MgIIλλ2796,2803 doublet. Only two absorption lines detected at the same redshift may lead to some false Mg II absorption line systems. In order to enhance the reliability of Mg II absorption line systems, we require that: (1) except for the Mg IIλλ2796,2803 doublet, one absorption system has at least two absorption lines at other rest-frame wavelengths that are detected at the same redshift, such as the series of absorption lines of Fe II, and Mg Iλ2852; and (2) the absorption lines strengths have  and
and  .
.
We find nine Mg II NALs with υr < −1000 km s−1 in the absorption line catalog of Chen et al. (2018a) that adhere to the criteria mentioned above. Redshifted Mg II NALs can originate from: (1) measurement errors of both the absorption line and emission line redshifts caused by the dispersion of absorption and emission lines; (2) [O II] emission line redshifts that do not represent the systemic quasar redshifts because gas flows within the emission line region may lead to an asymmetrical line profile; and (3) the Mg II NALs formed within external galaxies that are randomly moving in a cluster of large mass. The absorption features of all the nine Mg IIλλ2796,2803 doublets are very significant and have good line profiles. In addition, two lines from these doublets are clearly resolved with each other, and their line widths (σabs) are significantly less than 200 km s−1. Therefore, the absorption redshifts (zabs) of the Mg II NALs with υr < −1000 km s−1 determined from the Mg IIλλ2796,2803 doublets are accurate. We determine the quasar systemic redshifts through [O II] λ3728 narrow emission lines, which have line widths (σeml) of about 300 km s−1. Furthermore, both of the Mg II and [O II] emission lines have symmetrical profiles for all the quasars with redshifted Mg II NALs. In other words, we do not observe obvious outflow features in the broad Mg II and narrow [O II] emissions. Therefore, the quasar redshifts (zem) determined from [O II] are robust. Relative to the [O II] emission lines, the velocity offsets of the nine redshifted Mg II NALs are υr = 1071 − 1979 km s−1, which is significantly larger than the uncertainty (σdrift) contributed from line dispersions of the Mg II NALs and [O II] emission lines ( km s−1). Therefore, the large velocity offsets (υr < −1000 km s−1) of the nine redshifted Mg II NALs are less likely to originate from line dispersions.
It is well accepted that quasars reside within a host galaxy surrounded by circumgalactic medium (CGM). In addition, each quasar host galaxy is a member of a galaxy cluster. Absorption lines will be imprinted in the quasar spectra when the quasar center emission passes through its surrounding gas clouds located within an outflow, inflow, host galaxy, the CGM, or the intergalactic medium (IGM) of the galaxy cluster before it reaches the observer. Therefore, a clustering distribution of absorption systems is often detected around the quasar emission redshift relative to the cosmological absorptions (e.g., Nestor et al. 2008; Wild et al. 2008; Chen et al. 2015, 2018a). We reanalyze the velocity distribution of Mg II NALs included in Chen et al. (2018a), after removing quasars with zem ≥ 1.07 so that the quasar redshifts can be better determined from emission lines (e.g., Chen et al. 2018b). This cut reduces the number of Mg II NALs from the 17 316 in Chen et al. (2018a), leaving 6349 in the sample studied here. The velocity distribution of these 6349 Mg II NALs is shown in Fig. 1, which clearly shows that there is a significant excess around υr ≈ 0. This suggests that the Mg II absorptions are clustered around quasars. In addition, Fig. 1 implies that the velocity distribution of Mg II absorbers is complex, and the absorber sample should include absorptions that originate from the quasar’s outflow, inflow, surrounding environment, and foreground intervening galaxies. The intervening absorbers should have a uniform random velocity distribution at υr > 0. The absorbers from the surrounding environment should have a normal velocity distribution at υr = 0, which is destroyed by the outflow absorbers in the blue wing (υr > 0). The extended red wing of Fig. 1 (υr < 0) likely originates from inflow absorbers. Accounting for the multiple components of the velocity distribution, we invoke three Gaussian functions to describe the velocity distributions of the outflow (Gaussian center υr > 0), the surrounding environment (Gaussian center υr = 0), and the inflow (Gaussian center υr < 0) absorbers, and invoke a linear function with slope α = 0 to characterize the velocity distribution of the intervening absorbers. The results are shown with colored lines in Fig. 1, which clearly shown that all the inflow, environmental, and outflow absorbers are mixed in the velocity range of υr < 0. In addition, both the environment and outflow Mg II NALs are limited within υr > υ0 − 3σ > −1000 km s−1, where υ0 and σ are the Gaussian function fitting centers and dispersions, respectively. Therefore, υr < −1000 km s−1 is a good velocity cut to select the true inflow absorbers, which efficiently eliminates the contamination from the environment and outflow absorptions. Thus, the nine redshifted Mg II NALs with υr < −1000 km s−1 are statistically unlikely to be formed within an outflow or the external galaxies (environment) that are randomly moving in a cluster, and are likely truly inflowing toward quasar central regions.
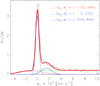 |
Fig. 1. Relative velocity distribution of 6349 Mg II NALs with zem < 1.07. The data are directly taken from the 17 316 Mg II NALs of Chen et al. (2018a). The red dashed, blue dashed, and blue solid curves indicate the Gaussian function fits corresponding to inflow, environment, and outflow Mg II NALs, respectively. The green solid line indicates the mean count at υr > 6000 km s−1, which corresponds to intervening Mg II NALs. The red solid curve is the sum of all the colored lines. The values shown in the top right corner are the Gaussian function fitting centers (υ0) and dispersions (σ). |
In line with the reasoning above, the nine redshifted Mg II NALs with υr < −1000 km s−1 likely originate from within the inflowing material. We show the spectra of these lines in Figs. 2 and 3. For all nine lines, we also measure the absorption strengths of the Mg Iλ2852, the series of Fe II, and the C IVλλ1548,1551 when available. The results are listed in Table 1.
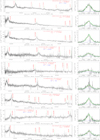 |
Fig. 2. SDSS quasar spectra. Left panel: green dashed lines indicate the positions of emission lines. The emission line redshifts zem are determined from the [O II] emission lines. The blue symbols are the radio loudness of quasars: |

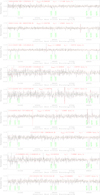 |
Fig. 3. Quasar spectra normalized by the fitting continuum. The red lines are the ±1σ flux uncertainty levels, which have also been normalized by the fitting continuum. Green dashed lines label the obvious absorption lines located at the same zabs, where the values of zabs are in the top of each figure. |
Measurements of absorption lines.
In order to measure the black hole mass and bolometric luminosities of quasars, we further analyzed the quasar spectra. All the quasar spectra are corrected for t Galactic extinction using the reddening measurements of Schlafly & Finkbeiner (2011) and the Milky Way extinction curve of Cardelli et al. (1989). We fit a local power-law continuum (fλ = Aλα) plus iron template (Vestergaard & Wilkes 2001) using the spectra data around the Mg II emission lines and not contaminated by the considered line emissions. Figure 2 shows the fitting results. The Mg II emission line properties are measured from the spectra subtracted by the continuum+iron fits. We used two Gaussian functions to fit the Mg II emission features, of which one, with FWHM > 1200 km s−1 (e.g., Shen et al. 2011; Chen et al. 2019), is for the broad Mg II component, and the other one, whose FWHM is determined from the [O II] emission lines, is for the narrow Mg II component. During the fits of emission lines, we exclude the spectral data around the strong Mg IIλλ2796,2803 absorption doublets. We derive the black hole mass MBH of each quasar via

where the calibrated coefficients (a, b) = (0.82, 0.5) are empirical values (e.g., Chen et al. 2019), and the L3000 is the monochromatic luminosity of each quasar at 3000 Å, which is estimated from the fitted power law. The bolometric luminosity of the quasars is directly derived from the monochromatic luminosity with standard bolometric correction, namely, Lbol = 5.15L3000 (Richards et al. 2006). We also estimate the mass accretion rate of black holes by  , where ϵ = 0.1 is the mass-to-radiation conversion efficiency. The Eddington ratio can be derived from η = Lbol/LEdd, where the Eddington luminosity LEdd = 1.38 × 1038(MBH/M⊙) erg s−1. The resulting L3000, MBH, ṀBH, and η are provided in Table 2.
Parameters of quasars and absorption line systems.
3. Results and discussions
In the following, we discuss the properties of the locations, mass inflow rates, radio emissions, and origins of the nine redshifted Mg II NALs with υr < −1000 km s−1.
3.1. Locations of infalling absorbers
We estimate the locations ( ) of these inflowing NALs assuming that they are initially formed in the hosting galaxies and then fall freely toward the center. Because of the drag force from the surrounding hot gas, the centrifugal force, and the potential radiation pressure from the central source, the true line-of-sight velocities of infalling NALs should be less than the free-fall velocities. Therefore, our estimated values are an upper limit for
  . We consider the gravitational potential contributed by the central SMBH and a Hernquist stellar distribution for the bulge of the hosting galaxy (Hernquist 1990). The bulge stellar mass M* is derived from the black hole mass MBH from the MBH − M* relation given by Häring & Rix (2004),
and the effective radius Re of the bulge stellar distribution is then determined from the observational Re − M* relation for early-type galaxies in Shen et al. (2003),
We then calculate the values of  assuming that the free-fall velocities of the gas clouds reach the observed inflowing velocities at
  in this potential well. The resulting distances of our inflowing absorbers
  are provided in Table 2. We find that the derived values of
  for our nine infalling Mg II NALs are all roughly 2 × 10⁴ Rg–2 × 10⁵ Rg, which is substantially lower than the radius of the sphere of influence of the central SMBHs (∼106 Rg assuming a representative bulge stellar velocity dispersion of ∼200 km s−1, Netzer 2015).
If considering that the inflowing NALs are initially formed around dusty tori, the infalling gas clouds are dominated by the gravitational field of the central SMBH. In this case, the resulting distances of inflowing absorbers  are lightly smaller than the
  . The resulting
  are also listed in Table 2.
Using the radius–luminosity relations, we derive the sizes of broad emission line regions (RBELR, Bentz et al. 2013), narrow emission line regions (RNELR, Mor & Netzer 2012), and the inner radius of the dusty torus (Rtorus, Nenkova et al. 2008) from quasar luminosities. The resulting RBELR, RNELR, and Rtorus for each quasar are shown in Fig. 4 and also listed in Table 2. It is clearly seen from Fig. 4 that the Rabs is just slightly larger than the inner radius of the dusty torus Rtorus, implying that the infalling Mg II NALs could be formed within the gas clouds located near the dusty tori.
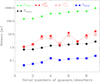 |
Fig. 4. Distances of the broad emission line region (RBELR), dusty torus (Rtorus), narrow emission line region (RNELR), and inflow cloud ( |


3.2. The mass-inflow rates
Assuming a simple model, namely that the infalling Mg II NALs are formed within a discrete cloud Zhou et al. (2019), we can estimate the mass inflow rate via

where μ = 1.4 is the mean atomic mass per proton, mp is the mass of a proton, NH, inflow is the column density of neutral hydrogen within the inflow cloud, ff is the filling factor of the absorbing clouds, the infalling distance dinflow is equals the distance Rabs of the absorbing cloud, Ωinflow is the global covering factor of the inflow structure, and tinflow is the in-falling timescale. Considering the gravitation and radiation pressure from the central region, the infalling timescale of the inflow absorber tinflow ≈ dinflow/υinflow when the absorber is falling toward central BH from the observed distance, where υinflow is equal to the relative velocity υr of the Mg II NALs measured from quasar spectra. The filling factor ff may be of the same order as the effective coverage fraction Cf of the absorbing cloud relative to background emission sources for the BALs (Zhou et al. 2019). However, the ff may be much smaller than the Cf for the NALs. In this paper, we only estimate the upper limit on the mass-inflow rate from Eq. (5), and therefore we still consider ff = Cf. This would not change our result.
Among the nine redshifted Mg II NALs with υr < 1000 km s−1, the high ionization C IV absorption is only available for one system, and we only detect the Mg+ and Fe+ iron absorption lines for the other eight systems with available spectra. The hydrogen column density (NH) of the inflowing absorbers cannot be accurately determined from the photoionization simulations (Ferland et al. 2017) if only the Mg+ and Fe+ iron absorption lines are available, because both the Mg+ and Fe+ ions have similar ionization potential. As a matter of fact, the metal BALs and DLAs (damped Lyα absorption line systems) often have a hydrogen column density significantly higher than 1020 cm−2, and the metal NALs usually have NH < 1020 cm−2. Here we assume NH = 1020 cm−2 for all nine inflowing Mg II NALs when estimating the upper limit of mass-inflow rates.
The absorption line intensity (I(υ)), which has been normalized by the background radiations, is a function of the optical depth (τ(υ)) and the effective coverage fraction (Cf(υ)) of the absorbing cloud to background emission sources. That is,
![$$ \begin{aligned} I(\upsilon )=[1-C_{\rm f}(\upsilon )]+C_{\rm f}(\upsilon )e^\mathrm{-\tau (\upsilon )}. \end{aligned} $$](/articles/aa/full_html/2022/03/aa42307-21/aa42307-21-eq37.gif)
For the Mg IIλλ2796,2803 doublet, which has an optical depth ratio of 2:1, we assume that Cf is the same for both lines. Therefore, we can obtain
![$$ \begin{aligned} C_{\rm f}(\upsilon )=\frac{[I_{\rm r}(\upsilon )-1]^2}{I_{\rm b}(\upsilon )-2I_{\rm r}(\upsilon )+1}. \end{aligned} $$](/articles/aa/full_html/2022/03/aa42307-21/aa42307-21-eq38.gif)
Considering the resolution of the SDSS spectra R = Δλ/λ ≈ 1800 and the line profile of the NAL, we only derive the effective coverage fraction of the absorbing cloud using the normalized intensities at the line cores. The results are provided in Table 2. We note that the Cf is only used to estimate the mass inflow rate (see Eq. (5)). In the following comparison (see Fig. 5), we see that an accurate Cf cannot change the results, and the Ṁinflow is still much less than the ṀBH, even if we adopt Cf = 1.
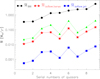 |
Fig. 5. Mass-accretion rate of the central black hole (black circles) and the mass-inflow rate of absorbing gas (colored symbols). Red stars are for Ωinflow = 0.6 (dusty torus), blue squares are for Ωinflow = 0.03 (back flow), and green triangles are for Ωinflow = 1 and Cf = 1. |
As values for NH = 1020 cm−2, Cf, Rabs, and υr are available, we can obtain Ṁinflow = (0.0183–0.2478) Ωinflow M⊙ yr−1 for our nine infalling Mg II NALs from Eq. (5), where the Ωinflow < 1. Figure 5 compares the mass accretion rate of the black hole and the mass inflow rate of absorbing gas for different Ωinflow values. It is clearly seen that Ṁinflow ≪ ṀBH, suggesting that the infalling NALs cannot provide sufficient fuel to power the quasars.
3.3. Properties of radio emissions
We collect quasar emission data at radio bands through the High Energy Astrophysics Science Archive Research Center Online Service provided by the NASA/Goddard Space Flight Center. We find that all of the nine quasars of our sample lie within the footprint of the Faint Images of the Radio Sky at Twenty centimeters (FIRST) survey. Therefore, first, we match our quasar sample to FIRST using a 5″ matching radius, which results in five quasars with the FIRST detections. Second, we match these five quasars with FIRST detections to other catalogs of radio observations using a 60″ matching radius. We find that, in addition to the 20 cm observations, there are four quasars that have been observed at other radio frequencies. For the quasars with the FIRST detection within a 5″ matching radius, we also match the quasars with the FIRST catalog using a 60″ matching radius. Within a 60″ matching radius, the quasars with only one counterpart in the FIRST catalog are likely to be core-dominated sources, and those with at least two counterparts in FIRST are likely to be lobe-dominated sources (e.g., Shen et al. 2011). Based on this criterion, we find that three quasars among the five with FIRST detections are core-dominated sources. This indicates that most of the quasars with FIRST detections are likely observed along the directions close to the axes of accretion disks (with small inclination angles), which are the directions at which the NALs associated with quasar outflows and winds were observed Hamann et al. (2012).
We also compute the radio loudness of quasars via

where f6 cm and f2500 are the flux density (fν) at 6 cm and 2500 Å, respectively. The f2500 is taken directly from the fitting power-law continuum of quasars at 2500 Å. The flux density at 6 cm rest-frame is estimated from multi-band measurements using the fitted power-law spectral index; otherwise it is from the only available FIRST observations assuming a spectral index of 0.5. During the power-law fits in radio bands, we adopt the total flux of all the components for the two lobe-dominated sources. We note that the observations at different radio bands were made at different resolutions, which may yield a different flux at the same frequency for the same source, especially for the extended sources. Radio observations from surveys other than FIRST (whose resolution is of 5″) were made at much lower resolutions (≥45″). Here, we compare the fluxes at 1.4 GHz obtained by FIRST and the National Radio Astronomy Observatory Very Large Array Sky Survey (NVSS, Condon et al. 1998, at a resolution of 45″), respectively. We find that the fluxes obtained by the FIRST are similar to those obtained by the NVSS, which indicates that the resolutions of the observations will not lead to significant differences in the calculations of radio indices.
The resulting R values from Eq. (8) are listed in Table 2. We find that R = 79, 546, 753, 5703, and 7717 for the five quasars with the FIRST detections, which are within the range covered by blazars (e.g., Fan et al. 2011; Pei et al. 2019, 2020). The radio loudness of quasars suggests that the five quasars within FIRST are likely blazars, which further supports the conclusion that these sources are likely observed along the directions close to the axes of accretion disks.
3.4. Eddington ratios
The Eddington ratios of the nine quasars with inflowing Mg II NALs are shown. We calculate the Eddingtong ratios for all the quasars with zem < 1.07 included in Chen et al. (2018a), where their black hole mass is available from previous works (e.g., Shen et al. 2011; Chen et al. 2018b, 2019). The results are shown in Fig. 6, which includes 2724 quasars. It is clearly seen from Fig. 1 that the Mg II NALs with 3 * 279 < υr < 1549 + 848 km s−1 would be dominated by outflow absorptions, where 279 km s−1 is the velocity dispersion of the environmental absorptions, 1548 km s−1 is the central velocity of the outflow absorptions, and 848 km s−1 is the velocity dispersion of the outflow absorptions. There are 338 quasars whose Mg II NALs fall into the velocity range of 3 * 279 < υr < 1549 + 848 km s−1. Here these 338 quasars are considered to be sources with outflow Mg II NALs, whose Eddington ratios are shown in Fig. 6. It is clearly seen from Fig. 6 that, on average, the quasars with inflowing Mg II NALs have a slightly smaller Eddington ratio relative to those with outflow Mg II NALs. It can be seen from Fig. 1 that the outflow component is significantly contaminated by the intervening absorptions in the velocity range of 3 * 279 < υr < 1549 + 848 km s−1. Therefore, the above definition of quasars with outflow Mg II NALs would significantly reduce the purity of a sample of quasars with outflow Mg II NALs. The Eddington ratios of the quasars with confirmed outflow Mg II NALs might be larger on average than those shown with the blue solid line in Fig. 6. Thus, Fig. 6 suggests that the quasars with inflowing Mg II NALs may have a lower radiation pressure with respect to the sources with outflow Mg II NALs. In the future, we will further investigate whether the properties of inflow and outflow Mg II NALs depend on the intrinsic characteristics of quasars, when a large sample of quasars with confirmed outflow Mg II NALs is available.
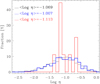 |
Fig. 6. Distributions of the Eddington ratios η of quasars. The black solid line is for all the quasars with zem < 1.07 (2724 quasars), whose black hole mass is available from previous works. The median value is ⟨Log η⟩ = −1.069. The blue solid line is for the quasars with outflow Mg II NALs (338 quasars), whose median value is ⟨Log η⟩ = −1.007. The red solid-line is for the nine quasars with inflowing Mg II NALs, whose median value is ⟨Log η⟩ = −1.113. |
4. The origins of infalling Mg II NALs
The upper limits on Rabs are around the regions of dusty tori. Therefore, one possible origin of the infalling Mg II NALs is that they are from dusty tori. Within the dusty tori, clouds have a Gaussian distribution along the angular direction, which decreases following 1/r or 1/r2 along the radial direction (Nenkova et al. 2008). Therefore, we assume a Gaussian distribution for the absorbing gas from the accretion disk plane, when the infalling Mg II NALs are formed within the dusty tori. That is,
where Ng is the column density of the gas cloud, N0 is a normalized parameter, β is the angle between the line of sight and the accretion disk plane, σ is a typical angle width of gas distribution, and the gas column density is a constant within the angle width ∣β ∣ ≤σ, namely, Ng = N0. Figure 7 shows the distribution of gas column density as a function of β for several σ. In this scenario, the BALs and NALs are observed along lines of sight with small and large β, respectively, which are consistent with the model of Hamann et al. (2012). Assuming that σ = 20° and the infalling BALs of quasar J103516.20 + 142200.6 (NH = 1023.46 cm−2, Zhou et al. 2019) was observed along the line of sight with β = 45°, we find that our infalling Mg II NALs (NH = 1020 cm−2) were observed along the directions with β ≈ 75°, which are quite close to the axes of accretion disks. Adopting Ωinflow = 0.6 (Zhou et al. 2019), we find that Ṁinflow = (0.0110–0.1487) M⊙ yr−1 if the infalling Mg II NALs are formed within dusty tori, which are about one order of magnitude lower than the accretion rates of black holes (see the red stars in Fig. 5).
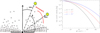 |
Fig. 7. Left panel: cartoon of the distribution of the absorbing gas from the accretion disk plane. i is the angle between the line of site and the axial direction of the accretion disk, and |

Alternatively, the infalling Mg II NALs may result from the interaction of AGN jets with the ISM, which leads to cold gas precipitation and chaotic cold accretion onto central SMBHs (e.g., Gaspari et al. 2013; Li & Bryan 2014). The jet–ISM interaction leads to nonlinear development of local thermal instability, and cold gas precipitates and falls back to the central regions preferentially along the directions close to the jet axis. Simulations indicate that with this mechanism, a majority of the cold gas forms at kiloparsec and larger distances away from the central SMBH. The detected infalling NALs are located on the parsec scale along the lines of sight relatively close to the axes of accretion disks, and therefore they may be originally formed almost along the jet axes on the kiloparsec scale. A natural place for the formation of these cold gaseous blobs is metal-rich trailing outflows uplifted by the jet ejecta through the Darwin drift mechanism (Guo et al. 2018; Duan & Guo 2018). The initially hot or warm gas converges and cools rapidly in trailing outflows, and the resulting cold NALs experience a transition from an initial outflowing stage to a later inflowing stage. The whole process is expected to last for about 100 Myr, long after the jet ejecta become undetectable at 20 cm. This picture is consistent with the rather high fraction (5/9) of the FIRST radio detection of our infalling Mg II NALs. The NAL absorbers may therefore provide direct evidence for cold gas precipitation and accretion in AGN feedback processes. In this picture, we expect that Ωinflow is significantly lower than 1. Adopting Ωinflow = 0.03, which corresponds to a half-opening angle of 15°, we find that Ṁinflow = (0.0005–0.0074) M⊙ yr−1, which is between two and three orders of magnitude lower than the accretion rates of black holes (see the blue squares in Fig. 5). These low mass-inflow rates are consistent with suggestions that the chaotic cold accretion cannot provide sufficient gas to trigger luminous quasars (e.g., Gaspari & Sądowski 2017; Storchi-Bergmann & Schnorr-Müller 2019).
In line with the above discussion, regardless of whether the infalling Mg II NALs are from the dusty tori or the chaotic cold accretion, the infalling NALs cannot provide sufficient fuel to power the quasars. Even if we adopt the upper limits of Cf = 1 and Ωinflow = 1, the mass inflow rate is still signficantly less than the mass-accretion rate of a black hole (see the green triangles in Fig. 5).
The inflowing gas of most BALs moves mainly along the directions close to the equatorial plane, where the radiation flux from the central engine is relatively small. The BAL absorbers will therefore experience weak radiation pressure and would be pulled onto accretion disks by the gravity of central SMBHs and provide materials to feed the growth of central SMBHs. However, the inflowing gas of NALs moves mainly along the directions close to the rotational axis of accretion disks. Strong radiation flux exists along these directions. Therefore, the NAL absorbers are expected to be decelerated by the radiation pressure. They may even become outflows by the radiation line force, although the quasar radiation is sub-Eddington (Proga 2007; Gaspari & Sądowski 2017). Therefore, the ultimate destiny of inflowing NALs is possibly different from that of inflowing BALs, where the inflowing BALs are transported to the accretion disks, and then feed the SMBHs.
5. Summary
Using the large quasar catalog from the SDSS, the aim of the present work is to search for redshifted, or infalling, Mg II NALs, in order to improve our understanding of the fueling and feedback mechanisms and processes of quasars. We obtained nine robust Mg II NALs with υr < −1000 km s−1, which are identified by the Mg IIλλ2796,2803 doublet, and at least two absorption lines at other rest-frame wavelengths, such as the series of absorption lines of Fe II, and the C IVλλ1548,1551. Every system is identified by more than four NALs, which guarantees that our nine Mg II NALs are reliable. Both the redshifts of the quasar (zem) and absorption (zabs) systems are determined by narrow lines, which guarantees the high accuracy of both the zem and zabs. In addition, the large inflowing speed (υr < −1000 km s−1) ensures that our nine Mg II NALs are most likely infalling toward quasar central regions. They are very unlikely to originate from the external galaxies that are randomly moving in the cluster of quasar host galaxy, and are highly unlikely to be formed within the gas clouds located within the quasar host galaxy or CGM.
The nine redshifted Mg II NALs are infalling toward quasar central regions at speeds of 1071–1979 km s−1, and are located around the dusty tori (may be less than 10 pc from their central SMBHs). Both the narrow line characteristic of absorption systems and strong radio emissions of quasars suggest that these redshifted Mg II NALs are likely along the directions close to the axes of accretion disks.
The quasars showing inflows might have lower radiation pressure when compared to the sources with outflows, which will be further studied when a large sample of quasars with confirmed outflow absorptions are available in the future.
Although we cannot confirm where the inflowing Mg II NALs come from with present data, there are two possible origins. One is within the dusty tori, while the other is the chaotic cold accretion resulting from the nonlinear interaction of AGN jets with the ISM, where the cold gaseous blobs may originally precipitate in metal-rich trailing outflows uplifted by AGN jet ejecta. Therefore, our inflowing Mg II NALs might be direct evidence of cold gas precipitation and accretion in AGN feedback processes, and direct evidence of inflowing gas along the directions close to quasar jets and at parsec scale. However, we note that the mass-inflow rates of the infalling Mg II NALs are much lower than the mass accretion rates of black holes, and therefore the infalling NALs cannot provide sufficient fuel to power the quasars.
Acknowledgments
Zhi-Fu Chen is supported by the Guangxi Natural Science Foundation (2019GXNSFFA245008), National Natural Science Foundation of China (12073007), the Guangxi Natural Science Foundation (GKAD19245136; 2018GXNSFAA050001), and Scientific research project of Guangxi University for Nationalities (2018KJQD01), National Natural Science Foundation of China (11763001). MFG is supported by the National Science Foundation of China (grant 11873073). Zhi-Cheng He is supported by NSFC-11903031, NSFC 12192221, and USTC Research Funds of the Double First-Class Initiative YD 3440002001. Fu-Lai Guo is supported by National Natural Science Foundation of China (11873072). D. F. Bu is supported by the National Natural Science Foundation of China (No. 12173065). Q. S. Gu is supported by the National Key Research and Development Program of China (No. 2017YFA0402703), the National Natural Science Foundation of China (No. 11733002, 12121003, 12192220, and 12192222) and the science research grants from the China Manned Space Project with No. CMS-CSST-2021-A05.
References
- Aird, J., Nandra, K., Laird, E. S., et al. 2010, MNRAS, 401, 2531 [Google Scholar]
- Bentz, M. C., Denney, K. D., Grier, C. J., et al. 2013, ApJ, 767, 149 [Google Scholar]
- Cardelli, J. A., Clayton, G. C., & Mathis, J. S. 1989, ApJ, 345, 245 [Google Scholar]
- Chen, Z.-F., Gu, Q.-S., & Chen, Y.-M. 2015, ApJS, 221, 32 [NASA ADS] [CrossRef] [Google Scholar]
- Chen, Z.-F., Huang, W.-R., Pang, T.-T., et al. 2018a, ApJS, 235, 11 [NASA ADS] [CrossRef] [Google Scholar]
- Chen, Z.-F., Pan, D.-S., Pang, T.-T., & Huang, Y. 2018b, ApJS, 234, 16 [NASA ADS] [CrossRef] [Google Scholar]
- Chen, Z.-F., Yi, S.-X., Pang, T.-T., et al. 2019, ApJS, 244, 36 [NASA ADS] [CrossRef] [Google Scholar]
- Condon, J. J., Cotton, W. D., Greisen, E. W., et al. 1998, AJ, 115, 1693 [Google Scholar]
- Duan, X., & Guo, F. 2018, ApJ, 861, 106 [NASA ADS] [CrossRef] [Google Scholar]
- Elvis, M. 2000, ApJ, 545, 63 [NASA ADS] [CrossRef] [Google Scholar]
- Elvis, M. 2017, ApJ, 847, 56 [NASA ADS] [CrossRef] [Google Scholar]
- Fan, J.-H., Yang, J.-H., Pan, J., & Hua, T.-X. 2011, Res. Astron. Astrophys., 11, 1413 [Google Scholar]
- Ferland, G. J., Hu, C., Wang, J.-M., et al. 2009, ApJ, 707, L82 [Google Scholar]
- Ferland, G. J., Chatzikos, M., Guzmán, F., et al. 2017, Rev. Mex. Astron. Astrofis., 53, 385 [NASA ADS] [Google Scholar]
- Ferrarese, L., & Merritt, D. 2000, ApJ, 539, L9 [Google Scholar]
- Gaskell, C. M., & Goosmann, R. W. 2013, ApJ, 769, 30 [NASA ADS] [CrossRef] [Google Scholar]
- Gaskell, C. M., & Goosmann, R. W. 2016, Ap&SS, 361, 67 [NASA ADS] [CrossRef] [Google Scholar]
- Gaspari, M., & Sądowski, A. 2017, ApJ, 837, 149 [NASA ADS] [CrossRef] [Google Scholar]
- Gaspari, M., Ruszkowski, M., & Oh, S. P. 2013, MNRAS, 432, 3401 [NASA ADS] [CrossRef] [Google Scholar]
- Gatti, M., Lamastra, A., Menci, N., Bongiorno, A., & Fiore, F. 2015, A&A, 576, A32 [NASA ADS] [CrossRef] [EDP Sciences] [Google Scholar]
- Grier, C. J., Pancoast, A., Barth, A. J., et al. 2017, ApJ, 849, 146 [NASA ADS] [CrossRef] [Google Scholar]
- Gu, M., Chen, Z., & Cao, X. 2009, MNRAS, 397, 1705 [NASA ADS] [CrossRef] [Google Scholar]
- Guo, F., Duan, X., & Yuan, Y.-F. 2018, MNRAS, 473, 1332 [NASA ADS] [CrossRef] [Google Scholar]
- Hall, P. B., Brandt, W. N., Petitjean, P., et al. 2013, MNRAS, 434, 222 [NASA ADS] [CrossRef] [Google Scholar]
- Hamann, F., Simon, L., Rodriguez Hidalgo, P., & Capellupo, D. 2012, in AGN Winds in Charleston, eds. G. Chartas, F. Hamann, & K. M. Leighly, ASP Conf. Ser., 460, 47 [NASA ADS] [Google Scholar]
- Häring, N., & Rix, H.-W. 2004, ApJ, 604, L89 [Google Scholar]
- Heckman, T. M., & Best, P. N. 2014, ARA&A, 52, 589 [Google Scholar]
- Hernquist, L. 1990, ApJ, 356, 359 [Google Scholar]
- Hu, C., Wang, J.-M., Ho, L. C., et al. 2008, ApJ, 687, 78 [Google Scholar]
- Kormendy, J., & Ho, L. C. 2013, ARA&A, 51, 511 [Google Scholar]
- Li, Y., & Bryan, G. L. 2014, ApJ, 789, 153 [Google Scholar]
- Madau, P., & Dickinson, M. 2014, ARA&A, 52, 415 [Google Scholar]
- Menci, N., Gatti, M., Fiore, F., & Lamastra, A. 2014, A&A, 569, A37 [NASA ADS] [CrossRef] [EDP Sciences] [Google Scholar]
- Mor, R., & Netzer, H. 2012, MNRAS, 420, 526 [NASA ADS] [CrossRef] [Google Scholar]
- Nenkova, M., Sirocky, M. M., Nikutta, R., Ivezić, Ž., & Elitzur, M. 2008, ApJ, 685, 160 [Google Scholar]
- Nestor, D., Hamann, F., & Rodriguez Hidalgo, P. 2008, MNRAS, 386, 2055 [NASA ADS] [CrossRef] [Google Scholar]
- Netzer, H. 2013, The Physics and Evolution of Active Galactic Nuclei (Cambridge, UK: Cambridge University Press) [Google Scholar]
- Netzer, H. 2015, ARA&A, 53, 365 [Google Scholar]
- Pâris, I., Petitjean, P., Ross, N. P., et al. 2017, A&A, 597, A79 [NASA ADS] [CrossRef] [EDP Sciences] [Google Scholar]
- Pei, Z.-Y., Fan, J.-H., Bastieri, D., Sawangwit, U., & Yang, J.-H. 2019, Res. Astron. Astrophys., 19, 070 [CrossRef] [Google Scholar]
- Pei, Z.-Y., Fan, J.-H., Bastieri, D., et al. 2020, Res. Astron. Astrophys., 20, 025 [Google Scholar]
- Proga, D. 2007, ApJ, 661, 693 [NASA ADS] [CrossRef] [Google Scholar]
- Richards, G. T., Lacy, M., Storrie-Lombardi, L. J., et al. 2006, ApJS, 166, 470 [Google Scholar]
- Schlafly, E. F., & Finkbeiner, D. P. 2011, ApJ, 737, 103 [Google Scholar]
- Shen, S., Mo, H. J., White, S. D. M., et al. 2003, MNRAS, 343, 978 [NASA ADS] [CrossRef] [Google Scholar]
- Shen, Y., Richards, G. T., Strauss, M. A., et al. 2011, ApJS, 194, 45 [Google Scholar]
- Shi, X.-H., Pan, X., Zhang, S.-H., et al. 2017, ApJ, 843, L14 [NASA ADS] [CrossRef] [Google Scholar]
- Simões Lopes, R. D., Storchi-Bergmann, T., de Fátima Saraiva, M., & Martini, P. 2007, ApJ, 655, 718 [Google Scholar]
- Storchi-Bergmann, T., & Schnorr-Müller, A. 2019, Nat. Astron., 3, 48 [Google Scholar]
- Treister, E., Schawinski, K., Urry, C. M., & Simmons, B. D. 2012, ApJ, 758, L39 [NASA ADS] [CrossRef] [Google Scholar]
- Vestergaard, M., & Wilkes, B. J. 2001, ApJS, 134, 1 [Google Scholar]
- Weymann, R. J., Williams, R. E., Peterson, B. M., & Turnshek, D. A. 1979, ApJ, 234, 33 [NASA ADS] [CrossRef] [Google Scholar]
- Wild, V., Kauffmann, G., White, S., et al. 2008, MNRAS, 388, 227 [NASA ADS] [CrossRef] [Google Scholar]
- Zhang, N.-X., Brandt, W. N., Ahmed, N. S., et al. 2017, ApJ, 839, 101 [NASA ADS] [CrossRef] [Google Scholar]
- Zhou, H., Shi, X., Yuan, W., et al. 2019, Nature, 573, 83 [NASA ADS] [CrossRef] [Google Scholar]
All Tables
All Figures
|
Fig. 1. Relative velocity distribution of 6349 Mg II NALs with zem < 1.07. The data are directly taken from the 17 316 Mg II NALs of Chen et al. (2018a). The red dashed, blue dashed, and blue solid curves indicate the Gaussian function fits corresponding to inflow, environment, and outflow Mg II NALs, respectively. The green solid line indicates the mean count at υr > 6000 km s−1, which corresponds to intervening Mg II NALs. The red solid curve is the sum of all the colored lines. The values shown in the top right corner are the Gaussian function fitting centers (υ0) and dispersions (σ). |
| In the text | |
|
Fig. 2. SDSS quasar spectra. Left panel: green dashed lines indicate the positions of emission lines. The emission line redshifts zem are determined from the [O II] emission lines. The blue symbols are the radio loudness of quasars: |
| In the text | |
|
Fig. 3. Quasar spectra normalized by the fitting continuum. The red lines are the ±1σ flux uncertainty levels, which have also been normalized by the fitting continuum. Green dashed lines label the obvious absorption lines located at the same zabs, where the values of zabs are in the top of each figure. |
| In the text | |
|
Fig. 4. Distances of the broad emission line region (RBELR), dusty torus (Rtorus), narrow emission line region (RNELR), and inflow cloud ( |
| In the text | |
|
Fig. 5. Mass-accretion rate of the central black hole (black circles) and the mass-inflow rate of absorbing gas (colored symbols). Red stars are for Ωinflow = 0.6 (dusty torus), blue squares are for Ωinflow = 0.03 (back flow), and green triangles are for Ωinflow = 1 and Cf = 1. |
| In the text | |
|
Fig. 6. Distributions of the Eddington ratios η of quasars. The black solid line is for all the quasars with zem < 1.07 (2724 quasars), whose black hole mass is available from previous works. The median value is ⟨Log η⟩ = −1.069. The blue solid line is for the quasars with outflow Mg II NALs (338 quasars), whose median value is ⟨Log η⟩ = −1.007. The red solid-line is for the nine quasars with inflowing Mg II NALs, whose median value is ⟨Log η⟩ = −1.113. |
| In the text | |
|
Fig. 7. Left panel: cartoon of the distribution of the absorbing gas from the accretion disk plane. i is the angle between the line of site and the axial direction of the accretion disk, and |
| In the text | |
Current usage metrics show cumulative count of Article Views (full-text article views including HTML views, PDF and ePub downloads, according to the available data) and Abstracts Views on Vision4Press platform.
Data correspond to usage on the plateform after 2015. The current usage metrics is available 48-96 hours after online publication and is updated daily on week days.
Initial download of the metrics may take a while.