Fig. 1.
Download original image
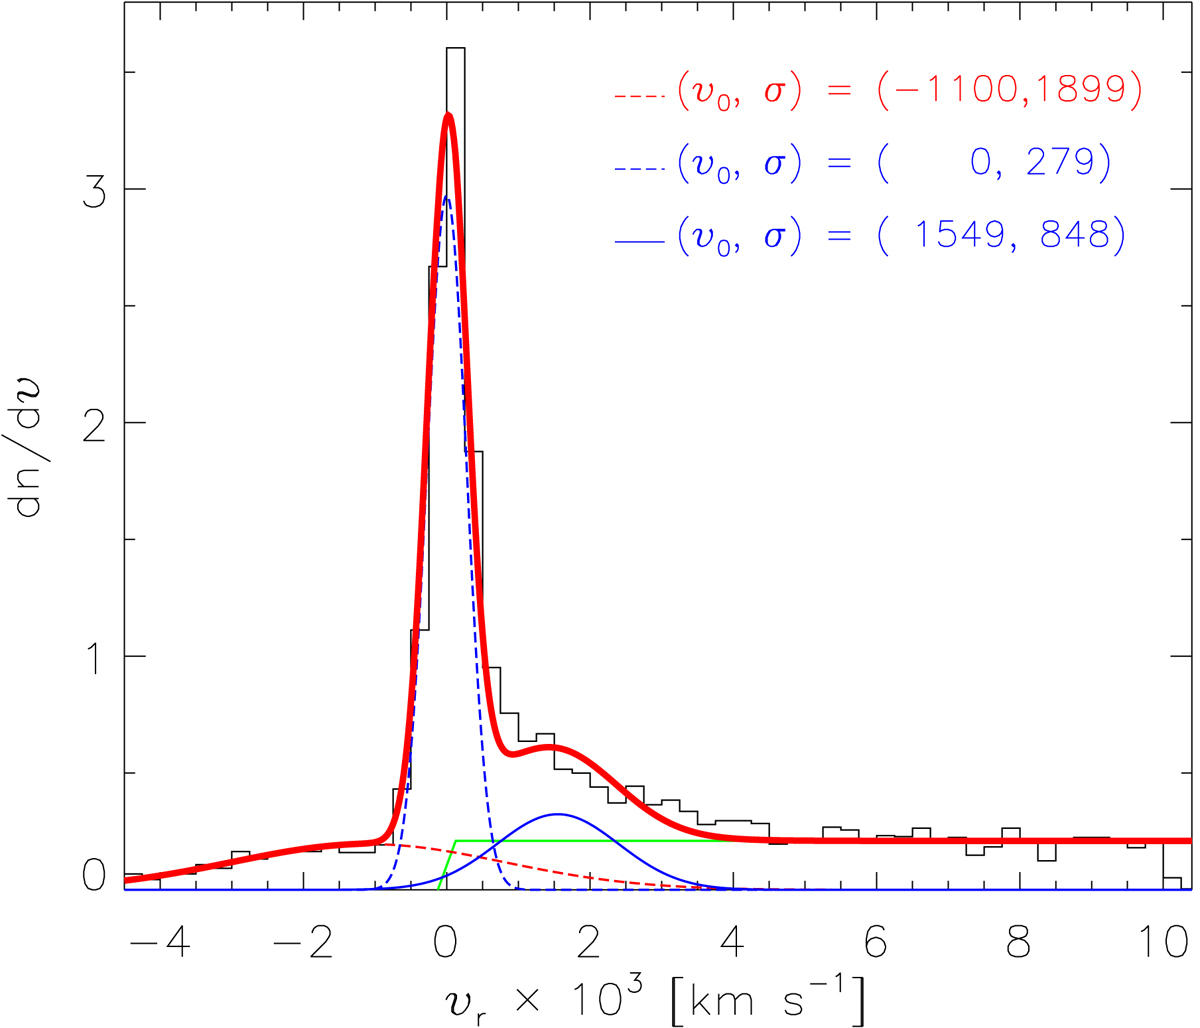
Relative velocity distribution of 6349 Mg II NALs with zem < 1.07. The data are directly taken from the 17 316 Mg II NALs of Chen et al. (2018a). The red dashed, blue dashed, and blue solid curves indicate the Gaussian function fits corresponding to inflow, environment, and outflow Mg II NALs, respectively. The green solid line indicates the mean count at υr > 6000 km s−1, which corresponds to intervening Mg II NALs. The red solid curve is the sum of all the colored lines. The values shown in the top right corner are the Gaussian function fitting centers (υ0) and dispersions (σ).
Current usage metrics show cumulative count of Article Views (full-text article views including HTML views, PDF and ePub downloads, according to the available data) and Abstracts Views on Vision4Press platform.
Data correspond to usage on the plateform after 2015. The current usage metrics is available 48-96 hours after online publication and is updated daily on week days.
Initial download of the metrics may take a while.