| Issue |
A&A
Volume 697, May 2025
|
|
|---|---|---|
| Article Number | A79 | |
| Number of page(s) | 6 | |
| Section | Extragalactic astronomy | |
| DOI | https://doi.org/10.1051/0004-6361/202553827 | |
| Published online | 07 May 2025 | |
Coordinated acceleration of two C IV broad absorption lines in quasar SDSS J093552.97+495314.3
1
College of Chemical and Environmental Engineering, Baise University, Baise 533000, China
2
School of Information Engineering, Baise University, Baise 533000, China
⋆ Corresponding author: william_lo@qq.com
Received:
20
January
2025
Accepted:
26
March
2025
We present an analysis of the newly identified coordinated velocity shift signatures observed within two C IV broad absorption lines (BALs) in the quasar SDSS J093552.97+495314.3 (located at a redshift of zem = 1.930). This particular quasar displays three distinct BAL systems, Systems A, B, and C. The coordinated velocity shifts in Systems A and B across two epochs of observations hint at potential accelerations within the outflows. Specifically, our findings reveal velocity shifts of approximately −1836 km s−1 for System A and −547 km s−1 for System B, occurring over a rest-frame time span of roughly 3.14 years. These shifts correspond to acceleration rates of −1.86 cm s−2 and −0.55 cm s−2, respectively. The concurrent occurrence of these velocity shifts among multiple components implies the presence of a unifying underlying mechanism. Additionally, these shifts are accompanied by variations in equivalent widths attributable to variations in the ionisation states of the clouds in response to changes in the ionising continuum. Based on these results, we postulate that the coordinated velocity shift signatures could be indicative of actual acceleration within the outflow clouds, driven primarily by radiation pressure emanating from the background light source.
Key words: galaxies: active / quasars: absorption lines / quasars: individual: SDSS J093552+495314
© The Authors 2025
 Open Access article, published by EDP Sciences, under the terms of the Creative Commons Attribution License (https://creativecommons.org/licenses/by/4.0), which permits unrestricted use, distribution, and reproduction in any medium, provided the original work is properly cited.
This article is published in open access under the Subscribe to Open model. Subscribe to A&A to support open access publication.
1. Introduction
Quasar outflows, manifesting prominently as broad absorption lines (BALs; with absorption widths of at least 2000 km s−1; Weymann et al. 1991) in their spectra, constitute a crucial aspect of active galactic nucleus research (e.g. Gibson et al. 2008, 2009; Capellupo et al. 2011, 2012, 2013; Filiz Ak et al. 2012, 2013, 2014; McGraw et al. 2015, 2017, 2018; He et al. 2017, 2019; Chen et al. 2022; Aromal et al. 2023, 2024). These outflows are widely recognised as playing a pivotal role in the coevolution of supermassive black holes and their host galaxies (e.g. Silk & Rees 1998; Fabian et al. 2002; Di Matteo et al. 2005; Arav et al. 2020; Laha et al. 2021, and references therein) by significantly influencing the distribution and kinematics of the surrounding interstellar medium (e.g. Somerville & Davé 2015; Naab & Ostriker 2017) and circumgalactic medium (e.g. Tumlinson et al. 2017; Pakmor et al. 2020; van de Voort et al. 2021; Faucher-Giguère & Oh 2023; Heesen et al. 2024). A notable characteristic of these outflows is their potential to exhibit velocity shifts, which may serve as indicators of the acceleration (e.g. Lu & Lin 2019a, 2020b; Xu et al. 2020; Aromal et al. 2021; Yi et al. 2024; Wheatley et al. 2024) or deceleration (e.g. Joshi et al. 2014; Grier et al. 2016; Joshi et al. 2019; Yi et al. 2024) of the outflowing gas. An understanding of these velocity shifts is indispensable for constraining the physical mechanisms that drive these outflows, including radiation pressure (e.g. Murray et al. 1995), magneto-centrifugal forces (e.g. Everett 2005), and thermal pressure (e.g. Balsara & Krolik 1993).
Despite the significant physical importance of BAL velocity shifts, the astrophysical community has faced limitations due to the scarcity of observational data on this phenomenon. Over the past two decades, only a few reports of velocity shift features in BALs have been published (Vilkoviskij & Irwin 2001; Rupke et al. 2002; Gabel et al. 2003; Hall et al. 2007; Joshi et al. 2014; Grier et al. 2016; Joshi et al. 2019; Lu & Lin 2019a, 2020b; Xu et al. 2020; Aromal et al. 2021; Yi et al. 2024; Wheatley et al. 2024). In recent years, systematic investigations of BAL velocity shifts using quasar samples and long time baselines have been undertaken (e.g. Grier et al. 2016; Wheatley et al. 2024). Nevertheless, these reports remain relatively rare, and the number of well-studied velocity shift cases is limited.
For instance, Grier et al. (2016) conducted the first systematic investigation of BAL acceleration candidates in a sample of quasars. By analysing multi-epoch observations of 140 quasars with BAL features, they identified only two quasars with robust evidence of acceleration in their BALs. This underscores the research gap in this field, that is, the limited number of well-studied cases of velocity shifts in quasar outflows and the lack of systematic investigations across large samples.
Moreover, many fundamental questions regarding BAL velocity shifts remain unanswered. The physical mechanisms responsible for BAL acceleration and deceleration are still the subject of debate. The relationship between BAL velocity shifts and other outflow properties, such as their ionisation state, equivalent width (EW), and outflow velocity, is also poorly understood. To overcome existing limitations and improve our understanding of quasar outflows, we have initiated a search for velocity-shifted BALs and have made a first breakthrough in terms of sample selection. Previous searches for velocity shifts in outflow absorption lines from samples have been confined to quasar samples with at least three observations (e.g. Grier et al. 2016). We conducted a search for quasars exhibiting velocity shift phenomena utilising a BAL catalogue compiled by He et al. (2017) that comprises 2005 quasars with observations from at least two epochs. We retrieved all available spectra for these 2005 quasars from the Sloan Digital Sky Survey (SDSS; York et al. 2000) Data Release 16 (DR16; Ahumada et al. 2020). We then co-plotted multiple spectra for each source on individual graphs. Two co-authors of our study independently performed visual inspections of the spectra to identify C IV and/or Si IV BAL features demonstrating velocity shifts. We have already found at least two cases of velocity shifts (e.g. Lu & Lin 2019a, 2020b). In this paper we analyse the signatures of velocity shifts in the quasar J093552.97+495314.3 (hereafter J0935+4953), which we identified through this initial visual inspection. Our objective is to pinpoint any velocity variations in the C IV and Si IV BALs based on its two-epoch spectra, and investigate their possible role in the acceleration dynamics of quasar outflows.
We describe the spectral data and analysis methods used in Sect. 2. We then present our results on the velocity shift signatures or EW variations in the C IV and/or Si IV BALs of J0935+4953, and discuss their implications for the acceleration mechanisms of quasar outflows in Sect. 3. We conclude our analysis in Sect. 4.
2. Spectrum analysis
We obtained spectral data for the quasar J0935+4953 from the SDSS DR16 (Ahumada et al. 2020, Lyke et al. 2020). The quasar SDSS J0935+4953 has a redshift of zem = 1.930, taken from the ‘BEST REDSHIFTS’ listed in the quasar catalogue of SDSS DR16 (Lyke et al. 2020). The two observations, archived on modified Julian dates (MJDs) 52 641 and 55 998, both had a spectral resolution of approximately R ∼ 2000. The spectrum from MJD 52 641 spanned a wavelength range from 3800 to 9200 Å, while the spectrum from MJD 55 998 extended from 3600 to 10 000 Å. The median signal-to-noise ratios for these spectra were 32.06 and 41.78, respectively.
Firstly, we iteratively fitted regions free of emission and absorption features, which resulted in a power-law continuum (Gibson et al. 2009) for each original spectrum (Fig. 1). We then combined the power-law fit with Gaussian fits to the emission lines to construct the pseudo-continuum (Gibson et al. 2008, 2009) for each spectrum (the dashed black and red curves in the top panel of Fig. 2). Using these pseudo-continua, we normalised the original spectra. Upon analysing the pseudo-continuum-normalised spectra, we identified three broad absorption systems (labelled Systems A to C) in C IV and/or Si IV ions in both epochs. We measured the EWs and full widths at half maximum of these components using methods previously described in Lu & Lin (2018a). It is important to note that in the second epoch, the C IV BAL of System A is blended with the Si IV BAL of System C, leading to an underestimation of the C IV measurement. The measurement results are summarised in Table 1.
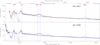 |
Fig. 1. Pseudo-continuum fits (solid purple and blue curves) for the two-epoch spectra of quasar J0935+4953. The flux density is expressed in units of 10−17 erg s−1 cm−2. Prominent emission lines are indicated by the vertical dashed blue lines spanning the two panels. The blue horizontal bars at the top of the upper panel denote the relatively line-free regions employed for fitting the power-law continua. The dashed purple line in the lower panel illustrates the final pseudo-continuum fit for the MJD 52 641 spectrum. The dotted lines at the base of each panel represent the formal 1σ uncertainties. |
Measurements of BALs.
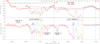 |
Fig. 2. Two-epoch spectra of quasar SDSS J0935+4953. The Si IV or C IV emission lines are marked by vertical dashed blue lines that extend across both panels. Upper panel: original spectra taken on MJD of 52 641 and 55 998 (solid black and red curves). The dashed black and red curves show the corresponding pseudo-continuum fits. The y-axis is given in units of 10−17 erg s−1 cm−2. The top x-axis shows the blueshift velocity (in 103 km s−1), calculated using the corresponding strongest line for the Si IV and C IV doublets. The solid lines at the bottom represent the formal 1σ errors. Bottom panel: pseudo-continuum normalised spectra corresponding to the original spectra shown in the upper panel. Horizontal solid black bars indicate the BAL range defined by the most extreme bounds observed over the two epochs. The vertical dotted black and red lines emphasise the line centres of the C IV BALs in Systems A and B, which display velocity shifts between two-epoch observations. The remaining vertical dotted multi-coloured lines mark the NAL systems within the C IV and Si IV BAL troughs, as located by the NAL features at the base of the Si IV BAL trough in System C. The bottom x-axis gives the rest-frame wavelength (in Å). |
Our analysis revealed velocity shifts of the C IV BALs in both Systems A and B between the two observations. The line centre of each BAL trough was calculated by evenly distributing its EW (e.g. Lu & Lin 2019a). To accurately determine these line centres, we generated 10 000 simulated spectra, incorporating Gaussian noise proportional to the flux density uncertainties of the initial spectral data (e.g. Shen et al. 2011; Lu & Lin 2019a, 2020b). This procedure was applied to both original spectra. Subsequently, the median values of the 10 000 computed line centres for each BAL, stemming from 10 000 iterations, were selected as their definitive line centres (depicted as dotted black and red vertical lines in Fig. 2). The standard deviations calculated over these iterations were utilised to quantify the measurement uncertainties. As a result, we determined the centroid radial velocities of the C IV BAL for System A in the MJD 52 641 and 55 998 spectra to be −35 039 ± 64 and −36 876 ± 208 km s−1, respectively. The velocity difference between these two epochs was −1836 ± 270 km s−1, equating to an acceleration rate of −1.86 ± 0.28 cm s−2 (in rest-frame). For the C IV BAL of System B, we obtained the centroid radial velocities of −27 392 ± 43 and −27 940 ± 33 km s−1, respectively in the two-epoch spectra, and the velocity difference between these two epochs was −547 ± 69 km s−1, corresponding to an acceleration rate of −0.55 ± 0.07 cm s−2 (in rest-frame).
To evaluate variations in the continuum flux, we integrated the flux within the wavelength range of 1560–1800 Å for each power-law continuum. Over a rest-frame time span of approximately 3.14 years, we observed a notable decrease in the continuum flux of quasar J0935+4953, with a fractional decrease of ∼10.5%.
3. Discussion
The findings presented in Sect. 2 offer valuable insights into the physical characteristics of the outflows. In this section we investigate more profoundly the absorption line systems associated with J0935+4953, focusing on key aspects such as origin, velocity, profile shape, EW variability, and velocity shift.
3.1. Origin, velocity, and profile shape
As illustrated in Figs. 1 and 2, within the observational wavelength range of SDSS, only the spectral regions of Si IV and C IV exhibit BAL signatures. Other ions, including Al III and Mg II, although within the observational range, do not display any detectable BAL features. More specifically, System A shows BAL signatures only in the C IV ion, while Systems B and C exhibit BAL features in both Si IV and C IV ions. Notably, none of the systems (A, B, or C) exhibit BAL signatures in the Al III or Mg II ions. We propose that all three systems (A, B, and C) most likely originate from outflowing gas intrinsic to the quasar, based on the following compelling evidence: (1) the presence of broad absorption trough profiles, and (2) the variability of these profiles. Firstly, all three systems display velocity widths exceeding 2000 km s−1, classifying them as typical BAL systems (Weymann et al. 1991). BALs are generally attributed to outflows, particularly in the case of System C, which covers a wavelength range over 12 000 km s−1. Such extensive absorption troughs are unlikely to be produced by intervening absorbers. Secondly, all three systems in J0935+4953 demonstrate EW variations between the two observational epochs, which are separated by 3.14 years in the quasar’s rest frame (Fig. 2 and Table 1). Temporal variability serves as a robust indicator for identifying intrinsic quasar absorption lines, as it is highly improbable for intervening absorbers to exhibit variability over such short timescales (e.g. Hamann et al. 1995; Barlow & Sargent 1997; Hamann et al. 1997).
Among the identified BALs, it is the high-velocity C IV BALs (Systems A and B) that exhibit notable velocity shifts. Previous investigations have found that, within sources exhibiting multiple absorption line systems, the system exhibiting the highest velocity often manifests characteristics indicative of velocity shifts. Aside from J0935+4953, several other instances exist, including SDSS J024221.87+004912.6 (Hall et al. 2007), SDSS J085551.25+375752.2 (Joshi et al. 2014), SDSS J091425.72+504854.9 (Grier et al. 2016), SDSS J092345.19+512710.1 (Joshi et al. 2019; Lin & Lu 2020a), SDSS J120819.29+035559.4 (Lu & Lin 2019a), SDSS J134444.33+315007.6 (Lu & Lin 2020b; Yi et al. 2024), SDSS J162122.54+075808.4 (Aromal et al. 2021), and SDSS J141007.72+541203.6 (Wheatley et al. 2024). These cases, which demonstrate velocity shifts in the faster absorption lines, corroborate another existing observations that C IV BAL troughs tend to exhibit greater variability at higher velocities (e.g. Capellupo et al. 2011, 2012, Filiz Ak et al. 2013, and Aromal et al. 2023, 2024).
Furthermore, within the detected BALs of J0935+4953, it is the C IV BALs of Systems A and B, distinguished by their smoother profile shapes, that exhibit notable velocity shifts. In recent research, based on the differences in the profile characteristics of the trough, BALs have been classified into two types: Type S BAL and Type N BAL (e.g. Lu & Lin 2018a, 2019c). Specifically, Type S BALs are characterised by a relatively smooth trough that resists decomposition into individual narrow absorption lines (NALs). Conversely, Type N BALs can be decomposed into multiple NALs, suggesting a potential overlap between certain BALs and intrinsic NALs. In J0935+4953, Systems A and B represent Type S BALs, featuring smooth, non-decomposable troughs. Regarding System C, although its C IV BAL displays a typical BAL profile shape that cannot be resolved into multiple NALs, its Si IV BAL reveals a distinct outline of multiple NAL troughs, makes it more like a Type N BAL. Based on the identifiable NAL features at the base of the Si IV BAL trough in System C, we can approximately locate several NALs within the BAL troughs. As illustrated in Fig. 2, four distinct NALs are detected.
Upon reviewing reported cases of velocity shifts, it becomes evident that BALs exhibiting velocity shifts are exclusively of the Type S variety. In instances where a velocity shift source features both Type N and Type S BALs, it is consistently the Type S BALs that demonstrate velocity shift characteristics. Examples include SDSS J024221.87+004912.6 (Hall et al. 2007), SDSS J085551.25+375752.2 (Joshi et al. 2014), SDSS J091425.72+504854.9 (Grier et al. 2016), SDSS J092345.19+512710.1 (Joshi et al. 2019; Lin & Lu 2020a), SDSS J120819.29+035559.4 (Lu & Lin 2019a), and SDSS J141007.72+541203.6 (Wheatley et al. 2024).
3.2. Coordinated variations
As shown in Fig. 2, the absorption systems exhibit notable observational features, specifically, the synchronised enhancement of EW and velocity shifts consistent with acceleration, observed across multiple C IV and/or Si IV BALs.
When considering the EW variation, previous research suggests two potential explanations. The first is the ionisation change scenario, which is responsive to variations in the ionisation continuum (e.g. Hamann et al. 2011; He et al. 2017; Lu et al. 2017, 2018; He et al. 2019). The second involves changes in the covering fractions due to clouds moving across our line of sight (LOS) to the background emission source (as discussed in Hamann et al. 2008).
Similarly, the velocity shift can be explained by two assumptions. The first is an actual change in the absorber’s velocity, driven by factors like radiation pressure from the background light source (e.g. Hall et al. 2007; Xu et al. 2020). The second is the transverse movement of absorbing clouds relative to the LOS, influenced by geometric projection effects resulting from disk rotation (e.g. Hall et al. 2002, 2013; Gabel et al. 2003; Joshi et al. 2014, 2019).
In the case of J0935+4953, we consider it improbable that line variations, including EW fluctuations and velocity shifts, are caused by clouds’ transverse movement relative to the LOS. This conclusion is drawn because the coordinated changes observed in multiple C IV and/or Si IV BALs would require highly synchronised movements among multiple absorbing structures within the outflow (e.g. Misawa et al. 2005; Hamann et al. 2011). Furthermore, in the case of transverse motion of absorbing clouds, the synchronised velocity shifts observed in multiple BALs suggest a concurrent disappearance (as the cloud moves out of the LOS) and reappearance (as the cloud moves into the LOS) of several outflow clouds within the same 3.14-year timescale in the quasar’s rest frame. Given the low individually observed BAL appearance and disappearance rates (ranging from 2.3% to 3.9%; Filiz Ak et al. 2012; De Cicco et al. 2017; McGraw et al. 2017), with observation durations spanning from 0.3 to 4.9 years in the rest frame, we find it highly unlikely for even a single velocity shift measurement, let alone the coordinated velocity shifts observed in multiple BALs.
3.2.1. Coordinated EW variations
For the primary mechanism driving the observed coordinated EW variations in J0935+4953, we favour the ionisation changes in response to fluctuations in the ionisation continuum, rather than the covering-fraction changes. This conclusion is supported by several factors.
Firstly, a key piece of evidence supporting this mechanism is the strengthening of the Si IV BAL in System C over a wide velocity range of approximately 9000 km s−1 (from −10 000 to −19 000 km s−1; see Fig. 2). Coordinated BAL variability across such a large velocity interval is more easily explained by scenarios involving ionisation changes (e.g. Grier et al. 2015; McGraw et al. 2017, 2018; Lu & Lin 2019c, 2020a,b; Lin & Lu 2020b). Explaining such behaviour under the transverse-motion mechanism would require coordinated movements of gas presumably existing at various distances from the supermassive black hole (see e.g. Hamann et al. 2011; Capellupo et al. 2013; Grier et al. 2015; Wang et al. 2015).
Secondly, multiple absorption components in J0935+4953 show coordinated EW strengthening between the two observational epochs. This strengthening involves System B for C IV ion and System C for both Si IV and C IV ions. Such coordinated variability among multiple absorption lines is more readily attributed to scenarios involving ionisation changes (e.g. Hamann et al. 2011; Lu & Lin 2019a, 2020b). It is worth noting that the C IV BAL of System A exhibits EW weakening between the two observations, seemingly uncoordinated with Systems B and C. However, as previously mentioned, the second epoch of the C IV BAL in System A is blended with the Si IV BAL in System C, leading to underestimated measurements that do not reflect the true situation. Furthermore, the change in the C IV BAL of System C is minimal, with only a portion of the BAL showing significant enhancement at approximately 18 000 km s−1 where the optical depth is smaller than the rest of the trough. The most convincing explanation suggests that the C IV BAL of System C is impacted by saturation, as evidenced by the comparable line depths observed between Si IV and C IV. Hamann (1998) utilised the CLOUDY code (Ferland 1996) to model and determine the theoretical optical depths of lines in constant-density, photoionised clouds with solar abundances and square absorption profiles exhibiting velocity widths of 10 000 km s−1. Figure 6 from Hamann (1998) demonstrates that, for ionisation parameters ranging from −1 < log U < +1, the predicted C IV BAL optical depths are at minimum ten times greater than those of the Si IV BAL. It is worth mentioning that, the Si IV NAL Systems 1–4, which are resolved from the Si IV BAL of System C, all exhibit comparable line depths to their corresponding C IV absorption lines (much less than a factor of 10 difference, as predicted by Cloudy simulation), further supporting saturation in these absorbers. A saturated BAL can respond weakly to continuum fluctuations or not at all under the ionisation change scenario as its variation mechanism. Additionally, these saturated lines do not reach zero intensity, suggesting partial coverage of these outflow clouds relative to the background light source.
Thirdly, between the two observations, a notable weakening in the continuum flux of the source was observed. Correlations between variations in the ionising continuum and those of outflow absorption lines have been reported (e.g. Lu et al. 2017; Chen et al. 2018a,b, 2019; Lu et al. 2018; Lu & Lin 2018b, 2019b; Huang et al. 2019; Vivek 2019; Lin et al. 2024), providing some evidence to support the ionisation change scenario as the primary driver of absorption line variability. In the case of J0935+4953, along with the strengthening of the absorption lines, the power-law continuum in the latter epoch is ∼10.5% lower than in the former epoch, aligning with previously reported anti-correlations.
3.2.2. Coordinated acceleration
Regarding the observed coordinated velocity shifts, we consider that the actual LOS acceleration provides a more plausible explanation than the crossing of clouds. This consideration is supported by several factors. Firstly, the velocity shifts are accompanied by variations in trough EW. The coordinated EW variability of multiple absorption lines in J0935+4953 has been confirmed to be driven by the ionisation change scenario in response to continuum variability, indicating the impact of fluctuating radiation energy. In other existing cases, it is also evident that velocity shifts typically coincide with EW variations (e.g. Joshi et al. 2014, 2019; Lu & Lin 2019a, 2020b; Lin & Lu 2020a; Aromal et al. 2021; Yi et al. 2024; Wheatley et al. 2024). Notable examples include SDSS J120819.29+035559.4 reported by Lu & Lin (2019a) and SDSS J134444.33+315007.6 by Lu & Lin (2020b), where ionisation-driven EW variations accompany velocity shifts. Both cases support the idea that ionisation changes are a more likely cause of absorption line variations than transverse motion. Consequently, the EW variations seen in cases like J0935+4953 in this study, as well as in SDSS J120819.29+035559.4 and SDSS J134444.33+315007.6, strongly suggest that the BAL outflows are influenced by background radiation energy. Therefore, when considering velocity shifts in BALs, it is essential to take into account the possibility of actual deceleration of outflow clouds due to radiation pressure from the background source.
Secondly, in J0935+4953, the C IV BALs of both Systems A and B exhibit coordinated velocity shifts, suggestive of acceleration. The synchronisation of these shifts across multiple components implies their common origin mechanism, which can naturally be attributed to an actual reduction in the outflow velocity of the material, driven by radiation pressure from the background light source. In the specific case of J0935+4953, we postulate that changing radiation energy may have led to an increase in injected momentum, thereby accelerating the wind. As mentioned above, over a rest-frame duration of approximately 3.14 years, we observed a notable weakening of the continuum in quasar J0935+4953, with a fractional decrease of roughly 10.5%. Additionally, as discussed earlier, the ionisation change scenario as driver of EW variations in response to continuum variability have been verified for the coordinated EW variability of multiple absorption lines in J0935+4953, further indicating the influence of fluctuating radiation energy. Hence, we infer that variations in radiative energy or momentum may primarily account for the observed coordinated velocity shifts.
It is worth noting that, in the existing literature, synchronised velocity shifts occurring across multiple absorption systems, as seen in the case presented in this paper, are relatively rare. In these literature, although there are also accounts of simultaneous kinematic changes in BALs across multiple ions, these velocity shift BALs actually belong to the same BAL system origin from a single absorber. For instance, Joshi et al. (2019) reported synchronised kinematic shifts of C IV and Si IV BALs in quasar SDSS J120819.29+035559.4, and Lu & Lin (2020b) documented synchronised velocity shifts of Mg II and Al III BALs in quasar SDSS J134444.33+315007.6. The only previously reported case exhibiting potential coordinated velocity shifts across multiple absorbers is quasar SDSS J162122.54+075808.4, which features two distinct broad absorption troughs: one associated with BAL acceleration accompanied by EW variability, and the other displaying complex profile variations (Aromal et al. 2021). When compared to quasar SDSS J162122.54+075808.4, J0935+4953 exhibits several notable distinctions. Firstly, J0935+4953 demonstrates more synchronised changes in both EW and velocity shifts. Secondly, unlike the widely separated distribution of the two distinct BAL troughs in SDSS J162122.54+075808.4, the BAL Systems A and B in J0935+4953 are closely spaced, indicating a tighter physical connection between these two absorption systems.
4. Conclusion
We have analysed recently identified velocity shifts within the two C IV BALs (of Systems A and B) in the quasar J0935+4953 by studying the spectral data from the SDSS. Key insights from our investigation include:
-
Velocity and profile analysis: The C IV BALs of Systems A and B, distinguished by their higher velocities and smoother profiles, demonstrated significant velocity shifts. Our observations are consistent with previous studies, which suggest that velocity shifts are commonly observed in BALs with the highest velocities and are always observed in Type S BALs.
-
EW variation: Considerable EW variations were found across multiple BALs during the two epochs of SDSS observations. These variations are believed to originate from variations in the ionisation state of the gas, which in turn are due to fluctuations in the ionising continuum.
-
Potential reasons for velocity shifts: Regarding the mechanisms behind the observed velocity shifts, we postulate that they reflect an actual acceleration of the outflow clouds, primarily influenced by radiation pressure emanating from the background light source. This conclusion is supported by the coordinated variations in velocity shifts and the ionisation-driven EW variations observed across multiple absorption lines.
In conclusion, our research emphasises the value of simultaneous velocity shifts and ionisation-driven EW variations in quasar BALs as indicators of the physical conditions and kinematics of outflows. Our findings contribute to the growing body of evidence supporting the critical role of radiation pressure in governing quasar outflow dynamics, which could have profound implications for galactic feedback models. Future investigations that integrate high-resolution spectroscopy and multi-wavelength observations promise to reveal even more about this intriguing quasar phenomenology.
Acknowledgments
We are deeply grateful to the reviewer for the valuable feedback and suggestions, which have improved the quality of this paper. This research was supported by the National Natural Science Foundation of China (12463003; 11903002), the Guangxi Natural Science Foundation (2025GXNSFAA069632). The observational data supporting the findings of this study are available from the corresponding author, Wei-Jian Lu (email: william_lo@qq.com), upon reasonable request. Funding for the Sloan Digital Sky Survey IV was provided by the Alfred P. Sloan Foundation, the U.S. Department of Energy Office of Science, and the Participating Institutions. SDSS-IV acknowledges support and resources from the Center for High-Performance Computing at the University of Utah. The SDSS website is http://www.sdss.org/. SDSS-IV is managed by the Astrophysical Research Consortium for the Participating Institutions of the SDSS Collaboration including the Brazilian Participation Group, the Carnegie Institution for Science, Carnegie Mellon University, the Chilean Participation Group, the French Participation Group, Harvard-Smithsonian Center for Astrophysics, Instituto de Astrofísica de Canarias, The Johns Hopkins University, Kavli Institute for the Physics and Mathematics of the Universe (IPMU)/University of Tokyo, Lawrence Berkeley National Laboratory, Leibniz Institut für Astrophysik Potsdam (AIP), Max-Planck-Institut für Astronomie (MPIA Heidelberg), Max-Planck-Institut für Astrophysik (MPA Garching), MaxPlanck-Institut für Extraterrestrische Physik (MPE), National Astronomical Observatories of China, New Mexico State University, New York University, University of Notre Dame, Observatário Nacional/MCTI, The Ohio State University, Pennsylvania State University, Shanghai Astronomical Observatory, United Kingdom Participation Group, Universidad Nacional Autónoma de México, University of Arizona, University of Colorado Boulder, University of Oxford, University of Portsmouth, University of Utah, University of Virginia, University of Washington, University of Wisconsin, Vanderbilt University, and Yale University.
References
- Ahumada, R., Prieto, C. A., Almeida, A., et al. 2020, ApJS, 249, 3 [Google Scholar]
- Arav, N., Xu, X., Miller, T., Kriss, G. A., & Plesha, R. 2020, ApJS, 247, 37 [Google Scholar]
- Aromal, P., Srianand, R., & Petitjean, P. 2021, MNRAS, 504, 5975 [NASA ADS] [CrossRef] [Google Scholar]
- Aromal, P., Srianand, R., & Petitjean, P. 2023, MNRAS, 522, 6374 [CrossRef] [Google Scholar]
- Aromal, P., Srianand, R., & Petitjean, P. 2024, MNRAS, 527, 12298 [Google Scholar]
- Balsara, D. S., & Krolik, J. H. 1993, ApJ, 402, 109 [NASA ADS] [CrossRef] [Google Scholar]
- Barlow, T. A., & Sargent, W. L. W. 1997, AJ, 113, 136 [Google Scholar]
- Capellupo, D. M., Hamann, F., Shields, J. C., Rodríguez Hidalgo, P., & Barlow, T. A. 2011, MNRAS, 413, 908 [NASA ADS] [CrossRef] [Google Scholar]
- Capellupo, D. M., Hamann, F., Shields, J. C., Rodríguez Hidalgo, P., & Barlow, T. A. 2012, MNRAS, 422, 3249 [CrossRef] [Google Scholar]
- Capellupo, D. M., Hamann, F., Shields, J. C., Halpern, J. P., & Barlow, T. A. 2013, MNRAS, 429, 1872 [CrossRef] [Google Scholar]
- Chen, Z.-F., Pang, T.-T., He, B., & Huang, Y. 2018a, ApJS, 236, 39 [Google Scholar]
- Chen, Z.-F., Yao, M., Pang, T.-T., et al. 2018b, ApJS, 239, 23 [Google Scholar]
- Chen, Z.-F., Yi, S.-X., Pang, T.-T., et al. 2019, ApJS, 243, 2 [Google Scholar]
- Chen, Z., He, Z., Ho, L. C., et al. 2022, Nature Astronomy, 6, 339 [NASA ADS] [CrossRef] [Google Scholar]
- De Cicco, D., Brandt, W. N., Grier, C. J., & Paolillo, M. 2017, Frontiers in Astronomy and Space Sciences, 4, 64 [NASA ADS] [CrossRef] [Google Scholar]
- Di Matteo, T., Springel, V., & Hernquist, L. 2005, Nature, 433, 604 [NASA ADS] [CrossRef] [Google Scholar]
- Everett, J. E. 2005, ApJ, 631, 689 [NASA ADS] [CrossRef] [Google Scholar]
- Fabian, A. C., Voigt, L. M., & Morris, R. G. 2002, Monthly Notices of the Royal Astronomical Society, 335, L71 [Google Scholar]
- Faucher-Giguère, C.-A., & Oh, S. P. 2023, ARA&A, 61, 131 [CrossRef] [Google Scholar]
- Ferland, G. J. 1996, Hazy, A Brief Introduction to Cloudy 90 (University of Kentucky Internal Report) [Google Scholar]
- Filiz Ak, N., Brandt, W. N., Hall, P. B., et al. 2012, ApJ, 757, 114 [NASA ADS] [CrossRef] [Google Scholar]
- Filiz Ak, N., Brandt, W. N., Hall, P. B., et al. 2013, ApJ, 777, 168 [NASA ADS] [CrossRef] [Google Scholar]
- Filiz Ak, N., Brandt, W. N., Hall, P. B., et al. 2014, ApJ, 791, 88 [Google Scholar]
- Gabel, J. R., Crenshaw, D. M., Kraemer, S. B., et al. 2003, ApJ, 583, 178 [NASA ADS] [CrossRef] [Google Scholar]
- Gibson, R. R., Brandt, W. N., Schneider, D. P., & Gallagher, S. C. 2008, ApJ, 675, 985 [NASA ADS] [CrossRef] [Google Scholar]
- Gibson, R. R., Jiang, L., Brandt, W. N., et al. 2009, ApJ, 692, 758 [Google Scholar]
- Grier, C. J., Hall, P. B., Brandt, W. N., et al. 2015, ApJ, 806, 111 [Google Scholar]
- Grier, C. J., Brandt, W. N., Hall, P. B., et al. 2016, ApJ, 824, 130 [Google Scholar]
- Hall, P. B., Anderson, S. F., Strauss, M. A., et al. 2002, ApJS, 141, 267 [NASA ADS] [CrossRef] [Google Scholar]
- Hall, P. B., Sadavoy, S. I., Hutsemekers, D., Everett, J. E., & Rafiee, A. 2007, ApJ, 665, 174 [NASA ADS] [CrossRef] [Google Scholar]
- Hall, P. B., Brandt, W. N., Petitjean, P., et al. 2013, MNRAS, 434, 222 [NASA ADS] [CrossRef] [Google Scholar]
- Hamann, F. 1998, ApJ, 500, 798 [NASA ADS] [CrossRef] [Google Scholar]
- Hamann, F., Barlow, T. A., Beaver, E. A., et al. 1995, ApJ, 443, 606 [Google Scholar]
- Hamann, F., Barlow, T. A., & Junkkarinen, V. 1997, ApJ, 478, 87 [Google Scholar]
- Hamann, F., Kaplan, K. F., Rodríguez Hidalgo, P., Prochaska, J. X., & Herbert-Fort, S. 2008, MNRAS, 391, L39 [Google Scholar]
- Hamann, F., Kanekar, N., Prochaska, J. X., et al. 2011, MNRAS, 410, 1957 [NASA ADS] [Google Scholar]
- He, Z., Wang, T., Zhou, H., et al. 2017, ApJS, 229, 22 [NASA ADS] [CrossRef] [Google Scholar]
- He, Z., Wang, T., Liu, G., et al. 2019, Nature Astronomy, 3, 265 [Google Scholar]
- Heesen, V., Schulz, S., Brüggen, M., et al. 2024, A&A, 682, A83 [NASA ADS] [CrossRef] [EDP Sciences] [Google Scholar]
- Huang, H.-Y., Pan, C.-J., Lu, W.-J., et al. 2019, MNRAS, 487, 2818 [Google Scholar]
- Joshi, R., Chand, H., Srianand, R., & Majumdar, J. 2014, MNRAS, 442, 862 [CrossRef] [Google Scholar]
- Joshi, R., Srianand, R., Chand, H., et al. 2019, ApJ, 871, 43 [NASA ADS] [CrossRef] [Google Scholar]
- Laha, S., Reynolds, C. S., Reeves, J., et al. 2021, Nature Astronomy, 5, 13 [Google Scholar]
- Lin, Y.-R., & Lu, W.-J. 2020a, ApJ, 899, 155 [NASA ADS] [CrossRef] [Google Scholar]
- Lin, Y.-R., & Lu, W.-J. 2020b, MNRAS, 497, 1457 [NASA ADS] [CrossRef] [Google Scholar]
- Lin, Y.-R., Pan, C.-J., & Lu, W.-J. 2024, Research in Astronomy and Astrophysics, 24, 025016 [Google Scholar]
- Lu, W.-J., & Lin, Y.-R. 2018a, MNRAS, 474, 3397 [CrossRef] [Google Scholar]
- Lu, W.-J., & Lin, Y.-R. 2018b, ApJ, 862, 46 [Google Scholar]
- Lu, W.-J., & Lin, Y.-R. 2019a, ApJ, 887, 178 [NASA ADS] [CrossRef] [Google Scholar]
- Lu, W.-J., & Lin, Y.-R. 2019b, ApJ, 883, 30 [Google Scholar]
- Lu, W.-J., & Lin, Y.-R. 2019c, ApJ, 881, 105 [NASA ADS] [CrossRef] [Google Scholar]
- Lu, W.-J., & Lin, Y.-R. 2020a, ApJ, 895, L44 [NASA ADS] [CrossRef] [Google Scholar]
- Lu, W.-J., & Lin, Y.-R. 2020b, MNRAS, 499, L58 [NASA ADS] [CrossRef] [Google Scholar]
- Lu, W.-J., Lin, Y.-R., Qin, Y.-P., et al. 2017, MNRAS, 468, L6 [Google Scholar]
- Lu, W.-J., Lin, Y.-R., & Qin, Y.-P. 2018, MNRAS, 473, L106 [Google Scholar]
- Lyke, B. W., Higley, A. N., McLane, J. N., et al. 2020, ApJS, 250, 8 [NASA ADS] [CrossRef] [Google Scholar]
- McGraw, S. M., Shields, J. C., Hamann, F. W., et al. 2015, MNRAS, 453, 1379 [NASA ADS] [CrossRef] [Google Scholar]
- McGraw, S. M., Brandt, W. N., Grier, C. J., et al. 2017, MNRAS, 469, 3163 [NASA ADS] [CrossRef] [Google Scholar]
- McGraw, S. M., Shields, J. C., Hamann, F. W., Capellupo, D. M., & Herbst, H. 2018, MNRAS, 475, 585 [Google Scholar]
- Misawa, T., Eracleous, M., Charlton, J. C., & Tajitsu, A. 2005, ApJ, 629, 115 [Google Scholar]
- Murray, N., Chiang, J., Grossman, S. A., & Voit, G. M. 1995, ApJ, 451, 498 [NASA ADS] [CrossRef] [Google Scholar]
- Naab, T., & Ostriker, J. P. 2017, ARA&A, 55, 59 [Google Scholar]
- Pakmor, R., van de Voort, F., Bieri, R., et al. 2020, MNRAS, 498, 3125 [NASA ADS] [CrossRef] [Google Scholar]
- Rupke, D. S., Veilleux, S., & Sanders, D. B. 2002, ApJ, 570, 588 [NASA ADS] [CrossRef] [Google Scholar]
- Shen, Y., Richards, G. T., Strauss, M. A., et al. 2011, ApJS, 194, 45 [Google Scholar]
- Silk, J., & Rees, M. J. 1998, A&A, 331, L1 [NASA ADS] [Google Scholar]
- Somerville, R. S., & Davé, R. 2015, ARA&A, 53, 51 [Google Scholar]
- Tumlinson, J., Peeples, M. S., & Werk, J. K. 2017, ARA&A, 55, 389 [Google Scholar]
- van de Voort, F., Bieri, R., Pakmor, R., et al. 2021, MNRAS, 501, 4888 [NASA ADS] [CrossRef] [Google Scholar]
- Vilkoviskij, E. Y., & Irwin, M. J. 2001, MNRAS, 321, 4 [NASA ADS] [CrossRef] [Google Scholar]
- Vivek, M. 2019, MNRAS, 486, 2379 [Google Scholar]
- Wang, T., Yang, C., Wang, H., & Ferland, G. 2015, ApJ, 814, 150 [Google Scholar]
- Weymann, R. J., Morris, S. L., Foltz, C. B., & Hewett, P. C. 1991, ApJ, 373, 23 [NASA ADS] [CrossRef] [Google Scholar]
- Wheatley, R., Grier, C. J., Hall, P. B., et al. 2024, ApJ, 968, 49 [NASA ADS] [CrossRef] [Google Scholar]
- Xu, X., Arav, N., Miller, T., Kriss, G. A., & Plesha, R. 2020, ApJS, 247, 40 [NASA ADS] [CrossRef] [Google Scholar]
- Yi, W., Hall, P. B., Yuan, Z., et al. 2024, ApJS, 271, 61 [NASA ADS] [CrossRef] [Google Scholar]
- York, D. G., Adelman, J., Anderson, J. E., Jr, et al. 2000, AJ, 120, 1579 [Google Scholar]
All Tables
All Figures
|
Fig. 1. Pseudo-continuum fits (solid purple and blue curves) for the two-epoch spectra of quasar J0935+4953. The flux density is expressed in units of 10−17 erg s−1 cm−2. Prominent emission lines are indicated by the vertical dashed blue lines spanning the two panels. The blue horizontal bars at the top of the upper panel denote the relatively line-free regions employed for fitting the power-law continua. The dashed purple line in the lower panel illustrates the final pseudo-continuum fit for the MJD 52 641 spectrum. The dotted lines at the base of each panel represent the formal 1σ uncertainties. |
| In the text | |
|
Fig. 2. Two-epoch spectra of quasar SDSS J0935+4953. The Si IV or C IV emission lines are marked by vertical dashed blue lines that extend across both panels. Upper panel: original spectra taken on MJD of 52 641 and 55 998 (solid black and red curves). The dashed black and red curves show the corresponding pseudo-continuum fits. The y-axis is given in units of 10−17 erg s−1 cm−2. The top x-axis shows the blueshift velocity (in 103 km s−1), calculated using the corresponding strongest line for the Si IV and C IV doublets. The solid lines at the bottom represent the formal 1σ errors. Bottom panel: pseudo-continuum normalised spectra corresponding to the original spectra shown in the upper panel. Horizontal solid black bars indicate the BAL range defined by the most extreme bounds observed over the two epochs. The vertical dotted black and red lines emphasise the line centres of the C IV BALs in Systems A and B, which display velocity shifts between two-epoch observations. The remaining vertical dotted multi-coloured lines mark the NAL systems within the C IV and Si IV BAL troughs, as located by the NAL features at the base of the Si IV BAL trough in System C. The bottom x-axis gives the rest-frame wavelength (in Å). |
| In the text | |
Current usage metrics show cumulative count of Article Views (full-text article views including HTML views, PDF and ePub downloads, according to the available data) and Abstracts Views on Vision4Press platform.
Data correspond to usage on the plateform after 2015. The current usage metrics is available 48-96 hours after online publication and is updated daily on week days.
Initial download of the metrics may take a while.