| Issue |
A&A
Volume 694, February 2025
|
|
|---|---|---|
| Article Number | A217 | |
| Number of page(s) | 5 | |
| Section | Extragalactic astronomy | |
| DOI | https://doi.org/10.1051/0004-6361/202452567 | |
| Published online | 14 February 2025 | |
Velocity shift of a C IV broad absorption line in quasar SDSS J145229.08+093204.9
1
School of Information Engineering, Baise University, Baise 533000, China
2
College of Chemical and Environmental Engineering, Baise University, Baise 533000, China
⋆ Corresponding author; This email address is being protected from spambots. You need JavaScript enabled to view it.
Received:
10
October
2024
Accepted:
23
January
2025
Abstract
We present the observation of a velocity shift in the broad absorption line (BAL) of C IV ion in quasar SDSS J145229.08+093204.9 (hereafter J1452+0932).This quasar exhibits three distinct BAL systems, designated as systems A, B, and C. Notably, system A, which possesses the highest velocity of approximately −23 000 km s−1, demonstrates a velocity shift of −1097 km s−1 in its C IV ion over a rest-frame period of approximately 1.7 years. To elucidate the nature of these variations, we conducted a comprehensive analysis focusing on the variation situation, location, ionisation state, and profile shape of the three BAL systems in J1452+0932. Our findings reveal that system A is situated closer to the central source compared to systems B and C. Furthermore, system A exhibits higher velocities, higher ionisation states, and smoother profile morphologies. These characteristics collectively suggest that the outflow generating system A is situated in a particularly extreme environment and experiences more pronounced impacts from background radiation energy than systems B and C. Consequently, we postulate that the observed velocity shift in system A may signify an actual line-of-sight acceleration of the outflow, induced by the radiation pressure emanating from the central source. Specifically, this scenario could occur if our line of sight intersects an outflow at a location where it is undergoing acceleration towards its terminal outflow velocity, or if a previously coasting outflow is undergoing renewed acceleration.
Key words: galaxies: active / quasars: absorption lines / quasars: individual: SDSS J145229.08+093204.9
© The Authors 2025
 Open Access article, published by EDP Sciences, under the terms of the Creative Commons Attribution License (https://creativecommons.org/licenses/by/4.0), which permits unrestricted use, distribution, and reproduction in any medium, provided the original work is properly cited.
This article is published in open access under the Subscribe to Open model. This email address is being protected from spambots. You need JavaScript enabled to view it. to support open access publication.
1. Introduction
Research on the velocity shift of quasar absorption lines is still in its infancy, yet its significance cannot be overlooked. The velocity shift can indicate the acceleration or deceleration of outflows, thereby revealing the kinematic characteristics and dynamical origins of these outflows (Grier et al. 2016). A direct detection of such velocity shifts would provide invaluable constraints on the underlying acceleration mechanisms. Three distinct processes have been proposed to account for wind acceleration: radiation pressure (resulting from the absorption of line photons; e.g. Murray et al. 1995), magneto-centrifugal forces (e.g. Everett 2005), and thermal pressure (e.g. Balsara & Krolik 1993).
Despite the significance of these velocity shifts, the scientific community has been limited by the scarcity of observational data. Over the past two decades, a limited number of studies have reported observations of velocity shifts (Vilkoviskij & Irwin 2001; Rupke et al. 2002; Gabel et al. 2003; Hall et al. 2007; Joshi et al. 2014; Grier et al. 2016; Joshi et al. 2019; Lu & Lin 2019a, 2020b; Xu et al. 2020; Aromal et al. 2021; Yi et al. 2024; Wheatley et al. 2024). However, cases of absorption line velocity shifts have been even rarer. Grier et al. (2016) conducted the first systematic investigation into the acceleration of broad absorption lines (BALs), finding that only two out of 140 quasars exhibited robust evidence of BAL acceleration, a detection rate of merely 1.43% (Grier et al. 2016). Their restriction of the search to quasars with at least three observations contributed to the small sample size, yet it sufficiently underscores the rarity of absorption line velocity shifts.
The physical mechanisms responsible for absorption line velocity shifts remain a subject of debate. Some argue that they represent actual accelerations or decelerations of outflowing material along the line of sight, while others argue that they arise from circular motion around the central massive black hole (Hall et al. 2002; Gabel et al. 2003; Hall et al. 2007; Joshi et al. 2014; Grier et al. 2016; Joshi et al. 2019). Definitive evidence that either scenario fully explains the observed velocity shift phenomenon is lacking. Specifically, studies have demonstrated that the acceleration magnitude is not uniform over time (e.g. Grier et al. 2016; Joshi et al. 2019; Wheatley et al. 2024), and the observed changes in the acceleration of candidate outflows are challenging to reconcile with standard disk-wind models or geometric projection effects (e.g. Grier et al. 2016). Our preliminary research found that absorption line velocity shifts often coincide with concurrent variability in equivalent width (EW), continuum flux, and/or emission lines, suggesting that radiation from the central source may play a driving role in this process (Lu & Lin 2019a, 2020b). Xu et al. (2020) present a relatively reliable case where the BAL velocity shift was attributed to outflow acceleration, as they were able to exclude other alternative possibilities, including photoionisation changes and the motion of outflow clouds into and out of the line of sight.
In summary, the scarcity of measured cases of BAL velocity shifts significantly hampers further research. To gain a deeper understanding of outflowing absorption line velocity shifts, it is crucial to search for additional observed cases. We have initiated a velocity shift search project that expands beyond previous studies limited to quasar samples with at least three observations (Grier et al. 2016) to include those with only two observations; this substantially increases the number of potential velocity shift cases. Notably, our previously reported two BAL velocity shift cases (Lu & Lin 2019a, 2020b) originated from a quasar with only two observations in the Sloan Digital Sky Survey (SDSS) dataset (York et al. 2000; Ahumada et al. 2020). As a pilot study of this project, we present a detailed analysis of a newly discovered velocity shift signature observed in a C IV BAL in quasar SDSS J145229.08+093204.9 (zem = 2.471; hereafter J1452+0932), which was identified through a preliminary visual inspection of the quasars repeatedly observed in the SDSS dataset.
The structure of this paper is as follows: Section 2 delineates the methodologies employed, presents the results of the spectral analysis, and details the measurements of the broad absorption troughs. Section 3 delves into the implications of our findings and discusses their broader scientific significance. Section 4 presents our conclusions.
2. Spectrum analysis
We acquired the spectral data for the quasar J1452+0932 from the SDSS Data Release 16 (DR16; Ahumada et al. 2020), which were archived on modified Julian dates (MJDs) 53827 and 55986, respectively. The spectral resolution for both observations is approximately R ∼ 2000. The spectrum obtained on MJD 53827 spans a wavelength range of 3800–9200 Å, whereas the spectrum on MJD 55986 covers a broader range from 3600 to 10 000 Å. The median signal-to-noise ratios for the spectra on MJDs 53827 and 55986 are 15 and 20, respectively.
To derive the continuum for each original spectrum, we iteratively fitted the regions relatively devoid of prominent emission and absorption lines. This process yielded a power-law continuum for each spectrum. Subsequently, we combined these power-law fits with Gaussian fits to the emission lines to produce the final pseudo-continuum. Utilising the respective pseudo-continua, we normalised the two original spectra. Upon inspection of the normalised spectra, we identified three broad absorption systems, designated as systems A, B, and C. We then measured the EWs and full widths at half maximum (FWHMs) of these absorption systems in the C IV and Si IV ions, employing methods previously outlined in our research (e.g. Eq. (2) and footnote of Table 1 in Lu & Lin 2018a). The results of these measurements are presented in Table 1.
Measurements of BALs.
It is worth mentioning that, compared to C IV BALs, Si IV absorption troughs exhibit much weaker intensities and appear within a narrower velocity range, aligning with previous systematic research (e.g. Gibson et al. 2009). Specifically, system A in the Si IV ion shows only a slight absorption line signal that is nearly indistinguishable. However, we emphasise that the absorption signatures of systems B and C in the Si IV ion are clearly detectable. For system B, the C IV trough includes a narrow absorption line (NAL) feature at a velocity of approximately −9000 km s−1, which may indicate an associated or intrinsic NAL with a different physical origin from the C IV BAL in system B. Therefore, we excluded this NAL feature when measuring the C IV BAL. Similarly, for system B, the Si IV trough includes an NAL feature at a velocity of approximately −11 000 km s−1, which may represent an intervening NAL. Consequently, we excluded this NAL feature when measuring the Si IV absorption trough. For the Si IV ion in system C, although no traditional BAL signature is detected, separate Si IV NALs are observed at the corresponding velocity of the C IV BAL of system C, suggesting that this C IV BAL of system C is actually composed of two pairs of NALs.
Our analysis revealed that system A exhibited a velocity shift between the two observations in the C IV ions. To determine the line centres of the BALs, we followed the methodology described in Lu & Lin (2019a), averaging the EWs of the troughs. For a more precise estimation of the line centres, we generated 10 000 simulated spectra by adding Gaussian noise to the original spectra, based on their corresponding flux density errors. We then applied the same procedure to measure the line centres for these simulated spectra. The line centre and its measurement errors were estimated using the median values and standard deviations, respectively, from the 10 000 trials. Consequently, we obtained the centroid radial velocities of the C IV BAL for system A in the MJD 53827 and 55986 spectra, which were −22 653 ± 151 and −23 751 ± 49 km s−1, respectively. The velocity difference between these two measurements was −1097 ± 196 km s−1, corresponding to an acceleration rate of −2.04 ± 0.37 cm s−2.
To ascertain the variability in the continuum flux, we integrated the flux over the wavelength range of 1420–1520 Å for each power-law continuum. Over a rest-frame period of approximately 1.7 years, we observed a slight strengthening in the continuum of quasar J1452+0932, with a fractional variation of approximately 0.124.
3. Discussion
The results in Sect. 2 provide important information on the physical conditions in the quasar outflows. Below, we discuss the physical relationships between systems A, B, and C from the following aspects: EW variation, ionisation state, location, and profile shape.
3.1. Equivalent width variation
J1452+0932 exhibit no significant variation in emission lines as well as the ionisation continuum, and the majority of the regions within the BALs also exhibit no significant EW variation during the two epochs of SDSS observations. An exception is noted in a specific segment of system B (C IV) at approximately −16 500 km s−1, where an abrupt enhancement is observed. Variations confined to limited portions of the broad troughs can be naturally explained by the movement of individual clouds or substructures within the flow across our line of sight, causing fluctuations in absorption (e.g. Capellupo et al. 2011, 2012, 2013).
When comparing existing cases, velocity shifts are typically accompanied by EW variations (Joshi et al. 2014, 2019; Lu & Lin 2019a, 2020b; Lin & Lu 2020a; Aromal et al. 2021; Yi et al. 2024; Wheatley et al. 2024). Notable examples of velocity shifts accompanied by EW variations include SDSS J120819.29+035559.4 (Lu & Lin 2019a) and SDSS J134444.33+315007.6 (Lu & Lin 2020b). SDSS J120819.29+035559.4 demonstrates a coordinated strengthening of multiple absorption lines, while SDSS J134444.33+315007.6 exhibits a synchronised enhancement in three Al III absorption troughs. Both variation phenomena support the notion that changes in ionisation are a more plausible cause of absorption line variations (compared to the transverse-motion scenario). Consequently, the EW variation characteristics observed in cases such as SDSS J120819.29+035559.4 and SDSS J134444.33+315007.6 convincingly suggest that the BAL outflows are influenced by background radiation energy. Thus, when explaining BAL velocity shifts, the possibility of actual deceleration of the outflow clouds driven by radiation pressure from the background source cannot be overlooked.
There are instances where velocity shifts occur without detectable photoionisation-driven EW variations, such as in the C IV BAL system A of J1452+0932 discussed in this paper (see also Grier et al. 2016; Xu et al. 2020). However, it is worth noting that BAL velocity shifts without accompanying EW variations, like those observed in the C IV BAL system A of J1452+0932, are rare. The absence of obvious EW variation in the BAL systems of J1452+0932 could be attributed to either small amplitudes of BAL EW variability that are below the detection threshold of the SDSS spectra due to their signal-to-noise ratio and resolution, or saturation effects within the BALs. Future monitoring, particularly high-resolution spectroscopic monitoring of J1452+0932, is crucial for understanding the varying conditions of the absorbing gas.
3.2. Velocity, ionisation state, and location
Among the three detected BAL systems, it is the fastest C IV BAL (system A) that exhibits a velocity shift signature. Comparison with previously detected cases reveals that the occurrence of velocity shifts in the fastest absorption lines is not coincidental. When a source possesses multiple absorption line systems, it is typically the system with the highest velocity that exhibits velocity shift characteristics. In addition to J1452+0932 presented in this study, such cases include SDSS J024221.87+004912.6 (Hall et al. 2007), SDSS J085551.25+375752.2 (Joshi et al. 2014), SDSS J091425.72+504854.9 (Grier et al. 2016), SDSS J092345.19+512710.1 (Joshi et al. 2019; Lin & Lu 2020a), SDSS J120819.29+035559.4 (Lu & Lin 2019a), SDSS J134444.33+315007.6 (Lu & Lin 2020b; Yi et al. 2024), SDSS J162122.54+075808.4 (Aromal et al. 2021), and SDSS J141007.72+541203.6 (Wheatley et al. 2024). This aligns with previous observations that absorbers at high velocities often exhibit dramatic variability.
We utilised the EW ratio of Si IV to C IV BALs, denoted as REW = EWSi IV/EWC IV, as an indicator of the ionisation state (He et al. 2017). Assuming a Gaussian distribution of optical depth, photoionisation simulations indicate that REW decreases as the ionisation parameter increases at a given hydrogen column density, NH (refer to Fig. 3 in He et al. 2017). As described in Sect. 2, for system A, the C IV BAL is present, while the relatively low ionisation lines of the Si IV ion in system A show only a slight absorption line signal that is nearly indistinguishable. In contrast, systems B and C simultaneously exhibit clearly detected C IV and Si IV absorption troughs. The higher degrees of ionisation in system A compared to systems B and C are evident. Furthermore, based on Table 1, we confirm that the REW (mean value of the two observations) for systems A, B, and C are 0.16, 0.21, and 0.46, respectively. Consequently, in J1452+0932, we infer that the relationship between the ionisation states of the absorbers responsible for systems A, B, and C is UA > UB > UC.
The distance of absorption gas (r) to the centre can, to a certain extent, be inferred from the ionisation parameter U, defined as U = QH/(4πr2nHc), where QH is the source emission rate of hydrogen-ionising photons, r is the distance from the absorber to the source, c is the speed of light, and nH is the hydrogen number density. Since systems A, B, and C are illuminated by the same background source, they share the same parameter QH. According to the definition of ions parameter U, higher ionisation parameter U indicates closer distance from the centre. Therefore, in J1452+0932, we derive rA < rB < rC.
Moreover, as illustrated in Fig. 1, system C is positioned near the centre of the broad emission lines (BELs), with its Si IV and C IV BALs exhibiting deeper absorption depths than the corresponding BELs’ protrusion. In contrast, system A is positioned at a higher velocity with no strong emission lines at its corresponding wavelength, suggesting that the absorbers producing system C cover both the continuum source and the broad emission-line region, while those producing system A cover only the continuum source. Therefore, the distance (r) from the flux source for the absorbers producing system A and C should be within and beyond the BEL region, respectively, which is consistent with the deduction from the discussion above. We note that these deductions are only approximate, as a typical BAL flow usually spans a range of velocities, and thus the absorber can be at any velocity. Especially considering that system C in J1452+0932 is a complex of NALs, these NALs may have different physical origins from each other. We defer a detailed study of these possibilities to future work.
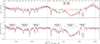 |
Fig. 1. Two-epoch spectra of quasar SDSS J1452+0932. The y-axis of the upper panel is in units of 10−17 erg s−1 cm−2. The top x-axis depicts the blueshift velocity, derived from the Si IV or C IV emission lines (in 103 km s−1), while the bottom x-axis indicates the rest-frame wavelength (in Å). Two vertical dashed blue lines, spanning both panels, signify the rest wavelengths of the Si IV and C IV emission lines. In the upper panel, the solid black and red lines represent pristine spectra obtained at two distinct epochs, with their MJDs indicated in the upper-right corner and coloured to match the corresponding spectra. The dashed black and red lines depict the respective pseudo-continuum fits. The solid black and red lines at the bottom of the upper panel are the formal 1σ errors. The bottom panel displays the pseudo-continuum-normalised spectra corresponding to the pristine spectra presented in the upper panel. Horizontal solid black bars delineate the BAL troughs imprinted on the spectra. The velocity range of a BAL is delineated by the most extreme limits observed across the two epochs. The vertical dotted black and red lines highlight the line centres of the C IV BAL of system A, which exhibit velocity shifts between observations at different epochs. |
3.3. Profile shape
Among the three detected BAL systems, it is the C IV BAL of system A, which exhibits the smoothest profile shape, that displays a velocity shift signature. Previous studies have reported that some BALs, classified as Type N BALs, can be readily decomposed into multiple NALs (Lu & Lin 2018a,b,c, 2019a,b,c, 2020a; Lin & Lu 2020a,b; Stathopoulos et al. 2019), suggesting that some BALs and intrinsic NALs are essentially the same phenomenon. Conversely, there exist Type S BALs, which possess a relatively smooth trough that cannot be decomposed into individual NALs. Lu & Lin (2019c) analysed the gradual transition from Type S to Type N BALs in the two-epoch spectra of the quasar SDSS J113009.40+495247.9 and found that both Type S and Type N BALs in this quasar probe the same clumped outflow. The difference between these two types of BALs is the fact that Type S BALs originate from the inner part of the outflow, which is characterised by a relatively high ionisation state, a lower column density, and more clumpy structures, whereas Type N BALs arise from the outer part, which features a relatively low ionisation state, a higher column density, and fewer clumpy structures.
In J1452+0932, we observe that the C IV BAL of system C is a typical Type N BAL, actually composed of two pairs of NALs, evident from its separated SiIV absorption lines. System A is a typical Type S BAL, exhibiting a relatively smooth trough that cannot be decomposed into individual NALs. System B, however, is in a transitional state between Type N and Type S BALs, with its C IV BAL displaying an approximate square-bottomed profile that cannot be decomposed into NALs but still shows a few distinguishable NAL troughs on the red wing.
Based on the above analysis, we find that the three BAL systems in J1452+0932 exhibit similar gradual transition phenomena in velocity, ionisation state, and profile shapes, just like the three BAL systems in quasar SDSS J113009.40+495247.9 (Lu & Lin 2019c). Furthermore, by examining the detected cases of velocity shifts, we observe that the BALs exhibiting velocity shifts are all Type S BALs. When a source possesses both Type N and Type S BALs, it is typically the Type S BALs that display velocity shift characteristics. Besides the case of J1452+0932 presented in this study, such examples include SDSS J024221.87+004912.6 (Hall et al. 2007), SDSS J085551.25+375752.2 (Joshi et al. 2014), SDSS J091425.72+504854.9 (Grier et al. 2016), SDSS J092345.19+512710.1 (Joshi et al. 2019; Lin & Lu 2020a), SDSS J120819.29+035559.4 (Lu & Lin 2019a), and SDSS J141007.72+541203.6 (Wheatley et al. 2024).
4. Conclusion and possible causes of velocity shifts
Conducting a comprehensive analysis of the variation situation, location, ionisation state, and profile shape of systems A, B, and C in J1452+0932, along with a comparative analysis with previous velocity shift cases, we have observed that the velocity shift phenomenon typically occurs in the inner part of the outflow. This region is characterised by relatively high velocities, higher ionisation states, and smoother profile shapes. The physical mechanism responsible for the velocity shift of absorption lines remains elusive, and there is currently no observational case of a velocity shift that can be fully explained by existing models. In the context of J1452+0932, relying solely on the data from two observations by the SDSS, we evaluated several possible models that could have potentially described the velocity shift behaviour observed in J1452+0932. However, we have been unable to conclusively determine the physical mechanism responsible for its line velocity shift.
First, we considered the possibility that changes in the ionisation state of the gas caused the observed velocity shift. Instead of a single outflow accelerating from v = −22 653 to −23 751 km s−1 between the MJD 53827 and 55986 epochs, we assumed two stationary outflows, each at a fixed velocity. In this scenario, changes in the absorption features between the two epochs would be explained by variations in the incident ionising flux of the quasar. However, this possibility can be ruled out based on the observational fact that J1452+0932 exhibits no unusual or extreme variations in emission lines or the ionisation continuum, and most regions within the BALs show no EW variation during the two SDSS observation epochs.
Secondly, we considered the possibility of transverse motion of absorbing clouds relative to the line of sight due to geometric projection effects from disk rotation (e.g. Hall et al. 2002, 2013; Gabel et al. 2003; Joshi et al. 2014, 2019). If this were the case, the BAL disappearance at −22 653 km s−1 and the new BAL appearance at −23 751 km s−1 would need to occur within the same 1.7 year interval (in the quasar’s rest frame). This is improbable given the low individually observed BAL appearance and disappearance rates (2.3%–3.9%; Filiz Ak et al. 2012; De Cicco et al. 2017; McGraw et al. 2017), with observation spans of 0.3–4.9 years in the rest frame.
Finally, we examined the possibility that the velocity shift observed in system A of quasar J1452+0932 may indicate an actual line-of-sight acceleration of an outflow due to radiation pressure from the central source. More specifically, the observed acceleration could be due to an increase in the outflow speed caused by incident ionising radiation (e.g. Murray et al. 1995). This could occur if our line of sight intersects an outflow at a location where it is being accelerated to its terminal outflow velocity, v∞, or if a previously coasting outflow is newly accelerated. We speculate that this explanation is possibly the reason for the velocity shift behaviour observed in J1452+0932. By comparing system A in J1452+0932, which exhibits a velocity shift, with systems B and C, which do not, we have found that system A is located closer to the central source and possesses higher velocities, higher ionisation states, and smoother morphological profiles. These characteristics suggest that the outflow that produced system A is in a rather extreme environment and is more severely impacted by background radiation energy than systems B and C.
To find further evidence supporting this deduction, we followed Grier et al. (2016) and examined whether the observed acceleration-like signature can be explained by an incident ionising radiation with a typical disk-wind model (Murray et al. 1995; Murray & Chiang 1997). We adopted Eqs. (1) and (3) from Sect. 4.1 of Grier et al. (2016):
 (1)
(1)
 (2)
(2)
where v∞ is the terminal outflow velocity, rL is the launching radius, r is the current radius, v(r) is the current velocity of the gas, and F is a scaling factor (∼1.5 − 3.5; Murray et al. 1995; Laor & Brandt 2002; Baskin et al. 2014). For this quasar, we have MBH ∼ 5.03 × 10⁹ M⊙ (Shen et al. 2011), and the average acceleration and observed velocities are 2.04 cm s−2 and 23 202 km s−1, respectively. The success of this model hinges on the concurrent satisfaction of Eqs. (1) and (2) through the application of appropriate values for F and r. We have identified an optimal solution where F = 3.2 and r/rL = 3. Utilising these two parameters, the model predicts a launching radius (rL) of approximately 0.16 pc and a terminal velocity of roughly 36 985 km s−1. These predictions imply that the absorber is situated at a distance of approximately 0.49 pc from the central black hole. Consequently, this model is deemed viable.
Acknowledgments
We acknowledge the referee for her/his constructive comments. This research was supported by the Guangxi Natural Science Foundation (No. 2021GXNSFBA220044;2024JJA110131), the National Natural Science Foundation of China (12463003;11903002). Funding for the Sloan Digital Sky Survey IV was provided by the Alfred P. Sloan Foundation, the U.S. Department of Energy Office of Science, and the Participating Institutions. SDSS-IV acknowledges support and resources from the Center for High-Performance Computing at the University of Utah. The SDSS website is http://www.sdss.org/. SDSS-IV is managed by the Astrophysical Research Consortium for the Participating Institutions of the SDSS Collaboration including the Brazilian Participation Group, the Carnegie Institution for Science, Carnegie Mellon University, the Chilean Participation Group, the French Participation Group, Harvard-Smithsonian Center for Astrophysics, Instituto de Astrofísica de Canarias, The Johns Hopkins University, Kavli Institute for the Physics and Mathematics of the Universe (IPMU)/University of Tokyo, Lawrence Berkeley National Laboratory, Leibniz Institut für Astrophysik Potsdam (AIP), Max-Planck-Institut für Astronomie (MPIA Heidelberg), Max-Planck-Institut für Astrophysik (MPA Garching), MaxPlanck-Institut für Extraterrestrische Physik (MPE), National Astronomical Observatories of China, New Mexico State University, New York University, University of Notre Dame, Observatário Nacional/MCTI, The Ohio State University, Pennsylvania State University, Shanghai Astronomical Observatory, United Kingdom Participation Group, Universidad Nacional Autónoma de México, University of Arizona, University of Colorado Boulder, University of Oxford, University of Portsmouth, University of Utah, University of Virginia, University of Washington, University of Wisconsin, Vanderbilt University, and Yale University.
References
- Ahumada, R., Prieto, C. A., Almeida, A., et al. 2020, ApJS, 249, 3 [Google Scholar]
- Aromal, P., Srianand, R., & Petitjean, P. 2021, MNRAS, 504, 5975 [NASA ADS] [CrossRef] [Google Scholar]
- Balsara, D. S., & Krolik, J. H. 1993, ApJ, 402, 109 [NASA ADS] [CrossRef] [Google Scholar]
- Baskin, A., Laor, A., & Stern, J. 2014, MNRAS, 445, 3025 [Google Scholar]
- Capellupo, D. M., Hamann, F., Shields, J. C., Rodríguez Hidalgo, P., & Barlow, T. A. 2011, MNRAS, 413, 908 [NASA ADS] [CrossRef] [Google Scholar]
- Capellupo, D. M., Hamann, F., Shields, J. C., Rodríguez Hidalgo, P., & Barlow, T. A. 2012, MNRAS, 422, 3249 [CrossRef] [Google Scholar]
- Capellupo, D. M., Hamann, F., Shields, J. C., Halpern, J. P., & Barlow, T. A. 2013, MNRAS, 429, 1872 [CrossRef] [Google Scholar]
- De Cicco, D., Brandt, W. N., Grier, C. J., & Paolillo, M. 2017, Frontiers in Astronomy and Space Sciences, 4, 64 [NASA ADS] [CrossRef] [Google Scholar]
- Everett, J. E. 2005, ApJ, 631, 689 [NASA ADS] [CrossRef] [Google Scholar]
- Filiz Ak, N., Brandt, W. N., Hall, P. B., et al. 2012, ApJ, 757, 114 [NASA ADS] [CrossRef] [Google Scholar]
- Gabel, J. R., Crenshaw, D. M., Kraemer, S. B., et al. 2003, ApJ, 583, 178 [NASA ADS] [CrossRef] [Google Scholar]
- Gibson, R. R., Jiang, L., Brandt, W. N., et al. 2009, ApJ, 692, 758 [Google Scholar]
- Grier, C. J., Brandt, W. N., Hall, P. B., et al. 2016, ApJ, 824, 130 [Google Scholar]
- Hall, P. B., Anderson, S. F., Strauss, M. A., et al. 2002, ApJS, 141, 267 [NASA ADS] [CrossRef] [Google Scholar]
- Hall, P. B., Sadavoy, S. I., Hutsemekers, D., Everett, J. E., & Rafiee, A. 2007, ApJ, 665, 174 [NASA ADS] [CrossRef] [Google Scholar]
- Hall, P. B., Brandt, W. N., Petitjean, P., et al. 2013, MNRAS, 434, 222 [NASA ADS] [CrossRef] [Google Scholar]
- He, Z., Wang, T., Zhou, H., et al. 2017, ApJS, 229, 22 [NASA ADS] [CrossRef] [Google Scholar]
- Joshi, R., Chand, H., Srianand, R., & Majumdar, J. 2014, MNRAS, 442, 862 [CrossRef] [Google Scholar]
- Joshi, R., Srianand, R., Chand, H., et al. 2019, ApJ, 871, 43 [NASA ADS] [CrossRef] [Google Scholar]
- Laor, A., & Brandt, W. N. 2002, ApJ, 569, 641 [NASA ADS] [CrossRef] [Google Scholar]
- Lin, Y.-R., & Lu, W.-J. 2020a, ApJ, 899, 155 [NASA ADS] [CrossRef] [Google Scholar]
- Lin, Y.-R., & Lu, W.-J. 2020b, MNRAS, 497, 1457 [NASA ADS] [CrossRef] [Google Scholar]
- Lu, W.-J., & Lin, Y.-R. 2018a, MNRAS, 474, 3397 [CrossRef] [Google Scholar]
- Lu, W.-J., & Lin, Y.-R. 2018b, ApJ, 863, 186 [Google Scholar]
- Lu, W.-J., & Lin, Y.-R. 2018c, ApJ, 862, 46 [Google Scholar]
- Lu, W.-J., & Lin, Y.-R. 2019a, ApJ, 887, 178 [NASA ADS] [CrossRef] [Google Scholar]
- Lu, W.-J., & Lin, Y.-R. 2019b, ApJ, 887, 119 [NASA ADS] [CrossRef] [Google Scholar]
- Lu, W.-J., & Lin, Y.-R. 2019c, ApJ, 881, 105 [NASA ADS] [CrossRef] [Google Scholar]
- Lu, W.-J., & Lin, Y.-R. 2020a, ApJ, 895, L44 [NASA ADS] [CrossRef] [Google Scholar]
- Lu, W.-J., & Lin, Y.-R. 2020b, MNRAS, 499, L58 [NASA ADS] [CrossRef] [Google Scholar]
- McGraw, S. M., Brandt, W. N., Grier, C. J., et al. 2017, MNRAS, 469, 3163 [NASA ADS] [CrossRef] [Google Scholar]
- Murray, N., & Chiang, J. 1997, ApJ, 474, 91 [NASA ADS] [CrossRef] [Google Scholar]
- Murray, N., Chiang, J., Grossman, S. A., & Voit, G. M. 1995, ApJ, 451, 498 [NASA ADS] [CrossRef] [Google Scholar]
- Rupke, D. S., Veilleux, S., & Sanders, D. B. 2002, ApJ, 570, 588 [NASA ADS] [CrossRef] [Google Scholar]
- Shen, Y., Richards, G. T., Strauss, M. A., et al. 2011, ApJS, 194, 45 [Google Scholar]
- Stathopoulos, D., Danezis, E., Lyratzi, E., Antoniou, A., & Tzimeas, D. 2019, MNRAS, 486, 894 [NASA ADS] [CrossRef] [Google Scholar]
- Vilkoviskij, E. Y., & Irwin, M. J. 2001, MNRAS, 321, 4 [NASA ADS] [CrossRef] [Google Scholar]
- Wheatley, R., Grier, C. J., Hall, P. B., et al. 2024, ApJ, 968, 49 [NASA ADS] [CrossRef] [Google Scholar]
- Xu, X., Arav, N., Miller, T., Kriss, G. A., & Plesha, R. 2020, ApJS, 247, 40 [NASA ADS] [CrossRef] [Google Scholar]
- Yi, W., Hall, P. B., Yuan, Z., et al. 2024, ApJS, 271, 61 [NASA ADS] [CrossRef] [Google Scholar]
- York, D. G., Adelman, J., Anderson, J. E., Jr, et al. 2000, AJ, 120, 1579 [Google Scholar]
All Tables
All Figures
|
Fig. 1. Two-epoch spectra of quasar SDSS J1452+0932. The y-axis of the upper panel is in units of 10−17 erg s−1 cm−2. The top x-axis depicts the blueshift velocity, derived from the Si IV or C IV emission lines (in 103 km s−1), while the bottom x-axis indicates the rest-frame wavelength (in Å). Two vertical dashed blue lines, spanning both panels, signify the rest wavelengths of the Si IV and C IV emission lines. In the upper panel, the solid black and red lines represent pristine spectra obtained at two distinct epochs, with their MJDs indicated in the upper-right corner and coloured to match the corresponding spectra. The dashed black and red lines depict the respective pseudo-continuum fits. The solid black and red lines at the bottom of the upper panel are the formal 1σ errors. The bottom panel displays the pseudo-continuum-normalised spectra corresponding to the pristine spectra presented in the upper panel. Horizontal solid black bars delineate the BAL troughs imprinted on the spectra. The velocity range of a BAL is delineated by the most extreme limits observed across the two epochs. The vertical dotted black and red lines highlight the line centres of the C IV BAL of system A, which exhibit velocity shifts between observations at different epochs. |
| In the text | |
Current usage metrics show cumulative count of Article Views (full-text article views including HTML views, PDF and ePub downloads, according to the available data) and Abstracts Views on Vision4Press platform.
Data correspond to usage on the plateform after 2015. The current usage metrics is available 48-96 hours after online publication and is updated daily on week days.
Initial download of the metrics may take a while.