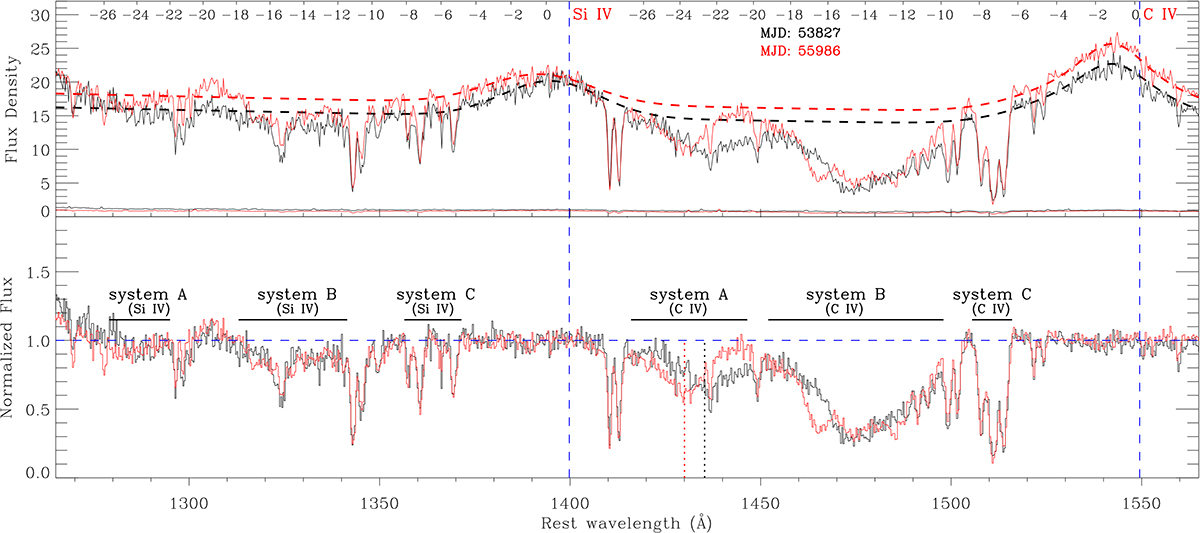
Fig. 1.
Download original image
Two-epoch spectra of quasar SDSS J1452+0932. The y-axis of the upper panel is in units of 10−17 erg s−1 cm−2. The top x-axis depicts the blueshift velocity, derived from the Si IV or C IV emission lines (in 103 km s−1), while the bottom x-axis indicates the rest-frame wavelength (in Å). Two vertical dashed blue lines, spanning both panels, signify the rest wavelengths of the Si IV and C IV emission lines. In the upper panel, the solid black and red lines represent pristine spectra obtained at two distinct epochs, with their MJDs indicated in the upper-right corner and coloured to match the corresponding spectra. The dashed black and red lines depict the respective pseudo-continuum fits. The solid black and red lines at the bottom of the upper panel are the formal 1σ errors. The bottom panel displays the pseudo-continuum-normalised spectra corresponding to the pristine spectra presented in the upper panel. Horizontal solid black bars delineate the BAL troughs imprinted on the spectra. The velocity range of a BAL is delineated by the most extreme limits observed across the two epochs. The vertical dotted black and red lines highlight the line centres of the C IV BAL of system A, which exhibit velocity shifts between observations at different epochs.
Current usage metrics show cumulative count of Article Views (full-text article views including HTML views, PDF and ePub downloads, according to the available data) and Abstracts Views on Vision4Press platform.
Data correspond to usage on the plateform after 2015. The current usage metrics is available 48-96 hours after online publication and is updated daily on week days.
Initial download of the metrics may take a while.