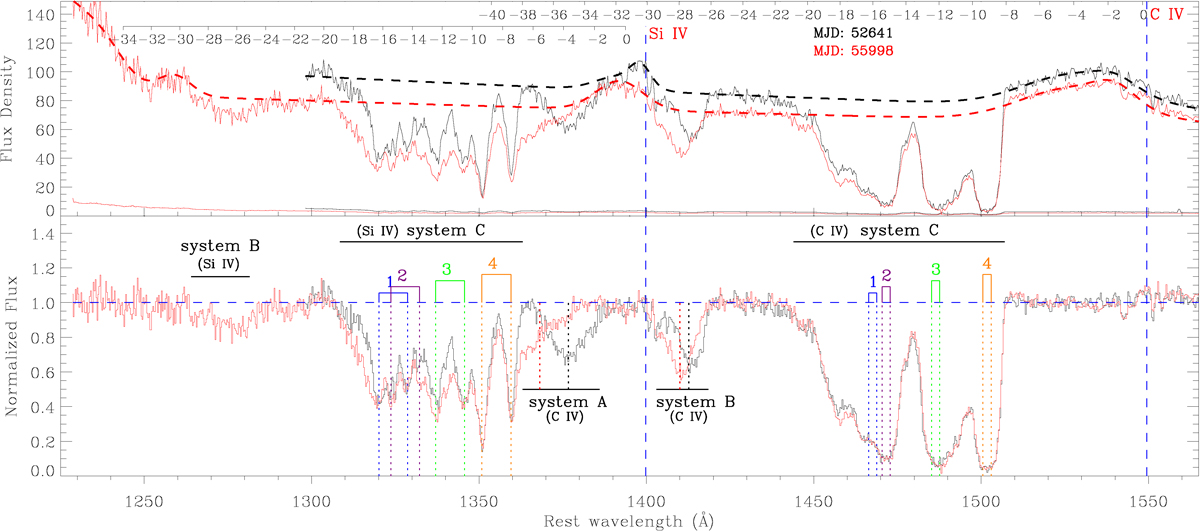
Fig. 2.
Download original image
Two-epoch spectra of quasar SDSS J0935+4953. The Si IV or C IV emission lines are marked by vertical dashed blue lines that extend across both panels. Upper panel: original spectra taken on MJD of 52 641 and 55 998 (solid black and red curves). The dashed black and red curves show the corresponding pseudo-continuum fits. The y-axis is given in units of 10−17 erg s−1 cm−2. The top x-axis shows the blueshift velocity (in 103 km s−1), calculated using the corresponding strongest line for the Si IV and C IV doublets. The solid lines at the bottom represent the formal 1σ errors. Bottom panel: pseudo-continuum normalised spectra corresponding to the original spectra shown in the upper panel. Horizontal solid black bars indicate the BAL range defined by the most extreme bounds observed over the two epochs. The vertical dotted black and red lines emphasise the line centres of the C IV BALs in Systems A and B, which display velocity shifts between two-epoch observations. The remaining vertical dotted multi-coloured lines mark the NAL systems within the C IV and Si IV BAL troughs, as located by the NAL features at the base of the Si IV BAL trough in System C. The bottom x-axis gives the rest-frame wavelength (in Å).
Current usage metrics show cumulative count of Article Views (full-text article views including HTML views, PDF and ePub downloads, according to the available data) and Abstracts Views on Vision4Press platform.
Data correspond to usage on the plateform after 2015. The current usage metrics is available 48-96 hours after online publication and is updated daily on week days.
Initial download of the metrics may take a while.