Fig. 1.
Download original image
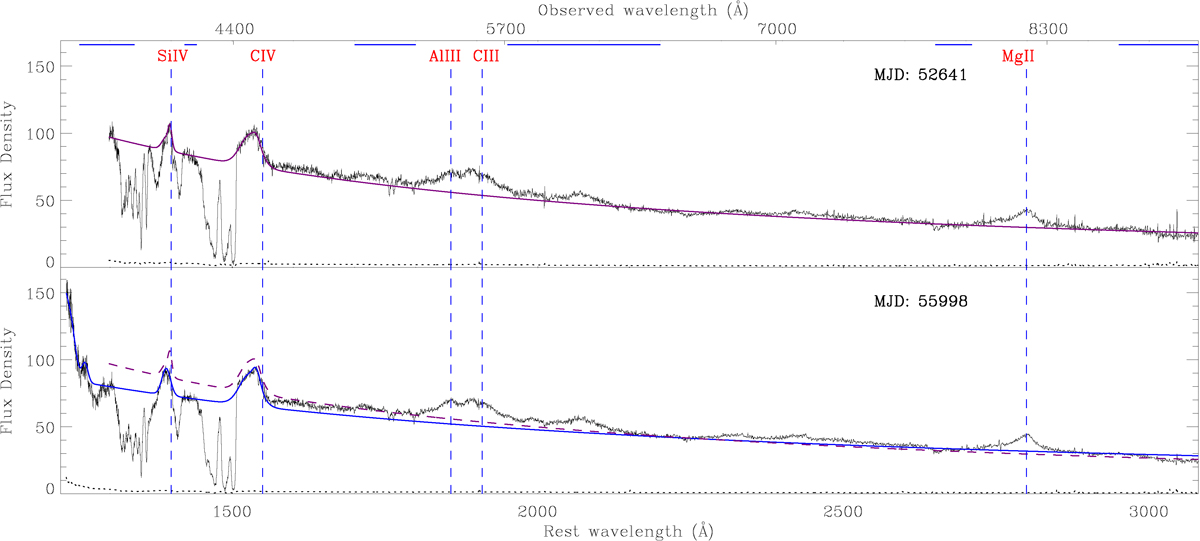
Pseudo-continuum fits (solid purple and blue curves) for the two-epoch spectra of quasar J0935+4953. The flux density is expressed in units of 10−17 erg s−1 cm−2. Prominent emission lines are indicated by the vertical dashed blue lines spanning the two panels. The blue horizontal bars at the top of the upper panel denote the relatively line-free regions employed for fitting the power-law continua. The dashed purple line in the lower panel illustrates the final pseudo-continuum fit for the MJD 52 641 spectrum. The dotted lines at the base of each panel represent the formal 1σ uncertainties.
Current usage metrics show cumulative count of Article Views (full-text article views including HTML views, PDF and ePub downloads, according to the available data) and Abstracts Views on Vision4Press platform.
Data correspond to usage on the plateform after 2015. The current usage metrics is available 48-96 hours after online publication and is updated daily on week days.
Initial download of the metrics may take a while.